Statistics online
Statistical tests, charts, probabilities and clear results. Automatically checks assumptions, interprets results and outputs graphs, histograms and other charts.
The statistics online calculators support not only the test statistic and the p-value but more results like effect size, test power, and the normality level.
If one of the validations fails, the tool recommends a solution.
What statistical test should you use? the following link will help you choose: choose a statistical test - decision questionnaire (Tutorial).
Test statistic calculators
Find the test statistic calculator
| Test | Assumptions | Required sample data | |||||||||||
|---|---|---|---|---|---|---|---|---|---|---|---|---|---|
| # | Test name | Check | Statistic | Ind | σ | σ1=σ2 | d | μ/p | x̄/p̂; | n | S | ||
| 1 | One Sample Z-Test | Mean | ✔ | ✔ | ✔ | ✔ | ✔ | ✔ | |||||
| 2 | One Sample T-Test | Mean | ✔ | ✔ | ✘ | ✔ | ✔ | ✔ | ✔ | ||||
| 3 | Two Sample Z-Test | Mean | ✔ | ✔ | ✔ | ✔ | ✔ | ✔ | |||||
| 4 | Two Sample T-Test (Pooled variance) | Mean | ✔ | ✔ | ✘ | ✔ | ✔ | ✔ | ✔ | ✔ | |||
| 5 | Two Sample T-Test (Welch's) | Mean | ✔ | ✔ | ✘ | ✘ | ✔ | ✔ | ✔ | ✔ | |||
| 6 | Two Sample Mann-Whitney U Test | Rank | ✔ | ✔ | ✔ | ||||||||
| 7 | Paired T-Test | Mean | ✔ | Paired | ✔ | ||||||||
| 8 | Paired Wilcoxon Sign Rank Test | Rank | Paired | ✔ | |||||||||
| 9 | One Way ANOVA Test | Mean | ✔ | ✔ | ✔ | ✔ | |||||||
| 10 | Repeated Measures ANOVA Test | Mean | ✔ | Dependent groups | Sphericity | ✔ | |||||||
| 11 | Friedman Test | Mean | Dependent groups | ✔ | |||||||||
| 12 | Kruskal-Wallis Test | Mean | ✔ | ✔ | |||||||||
| 13 | Two Way ANOVA Test Fixed model, Mixed model, Random mode, Mixed model with repeats | Mean | ✔ | ✔ | ✔ | ✔ | |||||||
| 14 | One Way MANOVA Test | Mean | ✔ | ✔ | ✔ | ✔ | |||||||
| 15 | One Sample Proportion Test | Proportion | Binomial | ✔ | ✔ | ✔ | ✔ | ||||||
| 16 | Two Sample Proportion Test | Proportion | Binomial | ✔ | ✔ | ✔ | |||||||
| 17 | Chi-Squared Test For Variance | σ | ✔ | ✔ | ✔ | ✔ | |||||||
| 18 | F Test For Variances | σ | ✔ | ✔ | ✔ | ✔ | |||||||
| 19 | Levene's Test For Variances | σ | ✘ | ✔ | ✔ | ||||||||
| 20 | Chi-Squared Test For Goodness Of Fit McNemar test, Chi-squared test for association, Fisher test, Binomial test | Fit | ✔ | ✔ | |||||||||
| 21 | Shapiro-Wilk Test | Fit | ✔ | ✔ | ✔ | ||||||||
| 22 | Kolmogorov Smirnov Test | Fit | D = Max1≤i≤n(Di+,Di-) | ✔ | ✔ | ||||||||
| 23 | Two-Sample Kolmogorov Smirnov Test | Fit | D = Max1≤i≤n(Di+,Di-) | ✔ | ✔ | ||||||||
| 24 | Kaplan Meier Survival Analysis | Survival | ✔ | ✔ | |||||||||
| 25 | DeLong test - Independent curves Compares the AUCs of two independent ROC curves | AUC | ✔ | ✔ | |||||||||
| 26 | DeLong test - Paired curves Compares the AUCs of two dependent ROC curves | AUC | Paired | ✔ | |||||||||
Regression calculator
| # | Regression | Statistic |
|---|---|---|
| 1 | Simple Linear Regression | |
| 2 | Multiple Linear Regression | |
| 3 | *Bulk Linear Regression | |
| 4 | Binary Logistic Regression | χ2 = 2(LL1-LL0) |
| 5 | Multinomial Logistic Regression | χ2 = 2(LL1-LL0) |
| 6 | Propensity Score Matching |  |
Confidence interval, Sample size, Effect Size
| # | Calculator | Image |
|---|---|---|
| Sample size calculators | ||
| Test power calculators | ||
| Effect size calculators | ||
| Confidence intervals calculators |
Distribution calculators


Statistical tables
Basic statistics calculators
Each statistics calculator contains step by step calculation.
| Calculator | Statistic calculator | Image |
|---|---|---|
| Statistics calculator | The calculator computes statistics such as count, average and standard deviation for each combination of the categorical variables. |  |
| Descriptive statistics calculator | The calculator computes statistics such as count, average, and standard deviation for each variable. |  |
| Percentile calculator | A percentile tells you the percentage of values below a given value in a data set. For example, a value at the 75th percentile means that 75% of the data lies below that value. |  |
| Mean Median Mode calculator | Q1, Q3, IRQ, Range |  |
| Measures Of Dispersion calculator | Mean, sample size, APA style | |
| Standard Deviation calculator | Mean, sample size, APA style | |
| Variance calculator | Variance, Mean, SEM, MAD | |
| Coefficient of Variation calculator | ||
| Average calculator | Average, Sum, Count | |
| Sample Mean calculator | Sample mean, Sum, Count | |
| Geometric Mean calculator | Product, n-th root | |
| Harmonic Mean calculator | The harmonic mean is a type of average used for rates, for example average speed. It is found by dividing n by the sum of the reciprocals of the values. | |
| Probability calculator | Probability formula, Dependent events, Bayes' Theorem, Independent events | P(A), P(A|B), P(A∩B), P(A∪B) |
| Combinations calculator | With/Without Repetitions |  , , |
| Permutation calculator | With/Without Repetitions |  , nr , nr |
| Correlation calculator | Pearson correlation, Spearman's rank correlation | |
| Outliers | Tukey's Fences (Boxplot), Z-Score | |
| Markov chain calculator | nth step probability vector, steady-state vector |  |
| Odds calculator | Odds to probability, probability to odds |  |
| Betting odds calculator | Fractional odds, decimal odds, American odds |  |
| Mean absolute deviation calculator | MAD calculator |  μ μ |
| Median absolute deviation calculator | MAD calculator | Mdn |
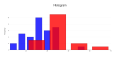
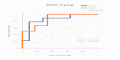
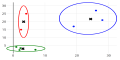
Visualization


Guide
- Guide
- Bonferroni correction
- Central Limit Theorem
- Confidence interval
- Linear regression
- Logistic regression
- Outliers
- P-value
- Skewness and kurtosis
- Standard deviation
- Test power
Exams
Free statistics exams with solution.
Statistical Tests
- Chi-squared test
- Levene's test
- Mann-Whitney U Rank test
- One Way ANOVA test
- Proportion test
- Shapiro Wilk test
- T-test
- T-test vs Z-Test
- Tukey HSD test
- Wilcoxon Sign Rank test
Goal
The goal of this website is to make statistics accessible to anyone, converting complex statistical jargon into common everyday language.
We help everybody to calculate statistics.
The calculators also provide R codes for your convenience.
We started adding a step-by-step work-through for education purposes, an easy guide on how to calculate test statistics.
Terms
We put in a lot of effort to provide accurate results and we automatically test every new page, The older pages were tested manually, but we slowly also automate the old pages.
We usually compare the results to the R results.
The information and tools on this website are given AS IS WITHOUT ANY WARRANTY OF ANY KIND.
Calculate statistics
The best online calculator to calculate statistics.