Histogram Maker
The histogram calculator generates a chart that displays the count of observations falling into each bin, in the form of a histogram.
For a more flexible histogram maker with more options, please go to an advanced histogram maker.
Data: use Enter as delimiter; you may change the delimiters on 'More options'.
How to use the histogram maker
The tool used to create histograms is also known as a histogram maker, histogram generator, or histogram calculator.
- Title - Fill in the chart title and font size
- Bar orientation - choose 'horizontal' for horizontal chart or 'vertical' for a vertical chart. When you change the orientation, the calculator will flip the axes headers.
- Bin size - By default, the histogram maker calculates the bin size automatically
- Legend - Choose from none, right, top, or inside the chart.
- Horizontal Axis - Enter the header, minimum, and maximum values, or leave the minimum and maximum fields empty for automatic calculation.
- Vertical Axis- - Enter the header, minimum, and maximum values, or leave the minimum and maximum fields empty for automatic calculation.
- Chart area - change the color of the chart area..
- Chart Background - Change the color of the chart background.
- Exclude outliers - Select this option to exclude outliers for better clarity.
- How to enter data?
Enter data in columns - For each column do the following:
a. Enter the name of the group.
b. Enter the raw data separated by new line ('enter'). (*you may copy the data without the header from Excel)
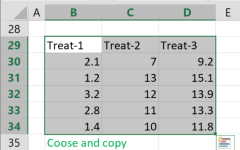
Enter data from Excel - Copy the raw data with the header from Excel or Google sheets, or any tool that separates data with tab and line feed. copy the entire block, include the header.
The histogram calculator ignores empty cells and non numeric cells.
Enter frequency table - Usually good for university questions.
a. On the first row, you may enter the name of the group instead of "Group-1"; this is not mandatory.
b. The left column contains the values; each value must be a number.
c. Enter the frequencies on the remaining cells. For example, the result of frequency of 4 for a value of 1 is: "1,1,1,1".
What is a histogram?
A histogram is a graphical representation of numerical data that shows the distribution of the data. If the number of observations is large and the bin size is small, the resulting histogram will resemble a density distribution chart.
How to create a histogram?
- Find the range of the numerical data Range = Max - Min.
- Choose the number of bins you want to use to present the data.
- Calculate the bin size: Bin size = Range/number of bins.
- For each bin, count the total number of observations that fall within it.
- Present the data as a column chart, where each column represents the number of observations in a bin.
How to choose the number of bins?
When the number of observations is large, you may want to use more bins. There are several ways to calculate the number of bins, for example: (n-sample size)
- Number of bins = sqrt(n)
- Number of bins = ⌈log2n⌉ + 1
- Number of bins = ⌈2 * n1/3⌉
- Number of bins = ⌈Range * n1/3 / (2 * IRQ)⌉
You can start with an automatic calculation and adjust the bin size to your preferred histogram.
Should you exclude outliers?
It is important to exercise caution before excluding outliers from any calculation, as they may contain valuable information. However, excluding outliers from a histogram may significantly improve its visualization, even if the outliers are valid observations. If you choose to exclude outliers, the histogram maker will generate the chart without them. This method can create a more practical histogram that better represents the distribution of the majority of the data points.
Why is histogram useful?
The histogram chart is a great way to visualize the distribution of data. While you can calculate many measures such as the minimum, maximum, average, median, mode, and standard deviation, a histogram always provides a clearer understanding of the data distribution.