Two-Sample KS Test Calculator
You may copy and paste data from Excel or Google Sheets. Leaving empty cells is okay. The tool doesn't count empty cells or non-numeric cells.
Two Sample Kolmogorov-Smirnov test
The two-sample Kolmogorov-Smirnov test compares data from two distributions and can reject the assumption of identical distributions.
Target
Checks whether two independent samples come from the same underlying distribution.
When using one tailed test, it checks if one sample comes from a higher underlying distribution.
Method
Automatic - we recommend using this method, the tool will use the exact calculation if there are no ties and n1*n2 < 10,000
Exact - the tool will use the exact calculation if there are no ties.
Approximation - the tool will use an approximation.
KS Distribution
Exact
[1]Recursive combinatorial calculation
To compute the exact method
Approximation
[2]The following corrections, improve the accuracy:
[3]
D statistic
The D statistic is the maximum distance between the CDF of group-2 and the CDF of group-1.
D+ : the maximum distance when group-2's CDF is larger than group-1's.
D- : the maximum distance when group-2's CDF is smaller than group-1's.
Two tailed test: D = Max(D+,D-); Right tailed test: D = D+; Left tailed test: D = D-;
Tails
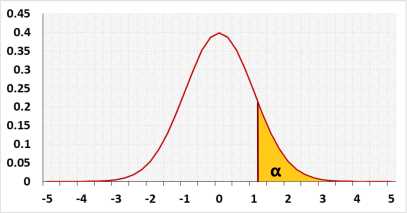
Since 'D' represents an absolute value, the distribution chart for both 'two-tailed' and 'left-tailed' tests resembles that of a right-tailed test.
| D+ = | i1 | - | i2 |
| n1 | n2 |
| D- = | i2 | - | i1 |
| n2 | n1 |

Effect size
We use the D statistic as effect size
We know only the sample effect size.
We define the effect levels as for the one sample KS test
The effect level is only wild rule of thumb, we still recommend to look at the Q-Q plot.
Reference
1. Thomas Viehmann (2021). "Numerically more stable computation of the p-values for the two-sample Kolmogorov=Smirnov test".2. Marsaglia G, Tsang WW, Wang J (2003). "Evaluating Kolmogorov's Distribution". Journal of Statistical Software. 8 (18): 1–4.
3. Vrbik, Jan (2018). "Small-Sample Corrections to Kolmogorov–Smirnov Test Statistic".