Kolmogorov-Smirnov Test Calculator
You may copy and paste data from Excel or Google Sheets. Leaving empty cells is okay. The tool doesn't count empty cells or non-numeric cells.
Kolmogorov-Smirnov test
The Kolmogorov-Smirnov test is not the most powerful test, but you may use it for any distribution.
For a normality test, if the data doesn't have repeated values we recommend using the Shapiro-Wilk test.
If the data contains repeated values we recommend using the D'Agostino-Pearson test.
Target
Checks if the distribution model fits the observations
The tool combines the following methods:
1. A formal normality test: Kolmogorov-Smirnov test.
2. Graphical methods: QQ-Plot chart and Histogram.
The Kolmogorov Smirnov test calculator uses when you know the parameters of the null distribution (H0). If you estimate the parameters from the sample data, the Kolmogorov Smirnov test is too conservative, and the test power is weak. In this case, if the distribution is normal, you should use the more powerful Lilliefors test calculator, which uses the same D statistics but adjusts the distribution to the fact that you estimate the parameters.
Lilliefors test
The Lilliefors test is a normality test that is relevant in cases where you don't know the parameters of the normal distribution, and you use the sample parameters as estimations for the distribution parameters. It is similar to the Kolmogorov-Smirnov test, with an identical statistic, but a different table that supports this scenario.
Type
Automatic - we recommend using this type, if you use the sample parameters of the normal distribution the tool will use the Lilliefors test calculator, otherwise, the tool will use the Kolmogorov Smirnov test calculator.
Kolmogorov Smirnov - the tool will use only the Kolmogorov Smirnov calculator.
Lilliefors - If the null distribution is normal, the tool will use the Lilliefors test calculator, even if you enter the normal distribution mean and standard deviation. for other null distributions, the tool will use the Kolmogorov Smirnov calculator.
Distribution
This is the null distribution, you try to check if the difference between the sample data and the null distribution is statistically significant.
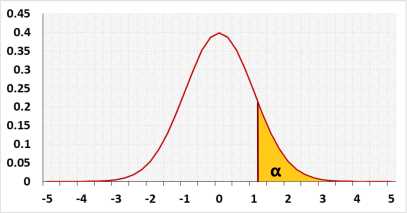
D statistic
D statistic is the maximum distance between the empirical CDF based on the sample data and the model CDF, for example, normal distribution.
D+ : the maximum distance when the empirical CDF is larger than the model CDF.
D- : the maximum distance when the empirical CDF is smaller than the model CDF.
D = Max(D+,D-);
| Di+ = | i | - FM |
| n |
| Di- = FM - | i -1 |
| n |
Normality effect size
We use the D statistic as effect size
We know only the sample effect size!.
We define the following effect levels of the effect size:
- Small - the effect size of Chi-squared(df=20)
- Medium - the effect size of Chi-squared(df=6)
- Large - the effect size of Chi-squared(df=3)
For the same distribution D depends on the sample size, we calculated the D per the following sample sizes: 10, 20, 40, 80, 160, 320, 640, 1280
We calculated the effect size of Chi-squared sample data using a simulation with 50,000 repeats.. The effect level is only wild rule of thumb, we still recommend to look at the Q-Q plot.