Shapiro-Wilk Test Calculator
*The maximum sample size is 5000
You may copy and paste data from Excel or Google Sheets. Leaving empty cells is okay. The tool doesn't count empty cells or non-numeric cells.
Information
Target: To check if the normal distribution model fits the observations
The tool combines the following methods:
1. A formal normality test: Shapiro-Wilk test. This is one of the most powerful normality tests.
2. Graphical methods: QQ-Plot chart and Histogram.
The Shapiro Wilk test uses only the right-tailed test. When performing the test, the W statistic is only positive and represents the difference between the estimated model and the observations. The bigger the statistic, the more likely the model is not correct. The left-tailed may represent a value that is too small, the W statistic can't be too small.
Small sample size (n ≤ 50)
When the sample size: the tool calculates the p-value from the exact tables, with the following p-values: 0.01 0.02 0.05 0.1 0.5 0.9 0.95 0.98 0.99. usually, the W value will be between two cells, and the p-value calculation will be done as a harmonic interpolation between the two p-values. The p-values are very accurate around the common significance levels.
Compare to other tests the Shapiro Wilk has a good power to reject the normality, but as with any other test it needs to have a sufficient sample size, around 20 depending on the distribution, see examples
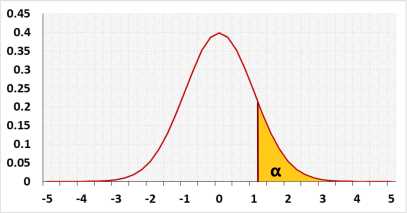
In this case, the normal distribution chart is only for illustration.
Large sample size (n > 50)
The tool uses the normal approximation. Since the sample size is large the approximation is good for any p-value.
* The maximum sample size is 5000, but since no distribution is exactly normal distribution, a very large sample size has the power to reject the normality assumption for almost any distribution even if the difference from the normal distribution is minimal.
If you need to test the average, and the sample size is large and reasonably symmetrical, even if the population distribution is not normal the average's distribution will be approximately normal (Central Limit Theorem).


Normality effect size
There is no agreed way to calculate the effect size, hence we use the Kolmogorov-Smirnov effect size to measure the deviation from the normality:
We know only the sample effect size!.
We defined the following effect levels of the effect size:
- Small - 0.0063, the effect size of Chi-squared(df=40)
- Medium - 0.00224, the effect size of Chi-squared(df=20)
- Large - 0.0427, the effect size of Chi-squared(df=5)
We calculated the effect size of Chi-squared sample data using a simulation with 10,000 repeats, each run over a sample size of 1000. The effect level is only a wild rule of thumb, we still recommend looking at the Q-Q plot.