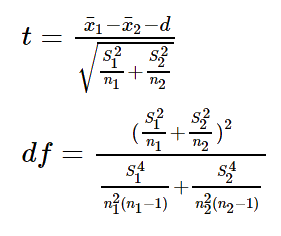
Two Sample T-Test Calculator (Welch's T-test)
Enter sample data
Header: You may change groups' name to the real names.
Data: When entering data, press Enter after each value.
Enter sample data
You may copy data from Excel, Google sheets or any tool that separate data with Tab and Line Feed.
Copy the data, one block of 2 consecutive columns includes the header, and paste below.
It is okay to leave empty cells, empty cells or non numeric cells won't be counted
Information
Target: To check if the difference between the average (mean) of two groups (populations) is significant, using sample dataExample1: A man of average is expected to be 10cm taller than a woman of average (d=10)
Example2: The average weight of an apple grown in field 1 is expected to be equal in weight to the average apple grown in field 2 (d=0)
Assumptions
| Normal distribution | |
| The standard deviations of both populations not necessarily equal, so either σ1=σ2 or ϭ1≠ϭ2 ) | |
| Expected difference d between the populations's average is known |
Required Sample Data
| x̄1, x̄2 - Sample average of group1 and group2 | |
| n1,n2 - Sample size of group1 and group2 | |
| S1,S2 - Sample standard deviation of group1 and group2 |
R Code
The following R code should produce the same results:
Examples
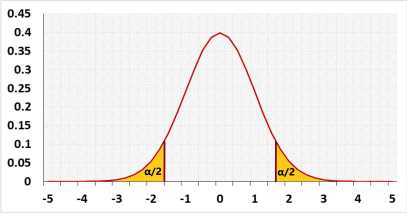
1. Two tailed test example:
A factory uses two identical machines to produce plastic plates. You would expect both machines to produce the same number of plates per minute.
Let μ1 = average number of plates produced by machine1 per minute.
Let μ2 = average number of plates produced by machine2 per minute.
We would expect μ1 to be equal to μ2. If one of the machines is slower than the other one, it should be serviced. In this case, we would like to know both if μ1 < μ2 or μ1 > μ2, since either machine could be slower.
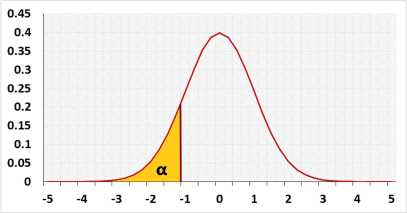
2. Left tail example.
A farmer uses fertilizer-1 with good results.
A friend told him fertilizer-2 is better than fertilizer #1.
Let μ1 = average number of potatoes per square meter in gardens using fertilizer-1.
Let μ2 = average number of potatoes per square meter in gardens using fertilizer-2.
The farmer assumes that the fertilizer currently in use (fertilizer-1) is better than the suggested one.(or equal)
He is willing to change fertilizer only if the new one is better.
A one-tailed test is controversial. It increase the type I error. In this example, it may be important to know if fertilizer-2 is less effectinve than fertilizer-1, and use the two-tailes test.