Venn Diagram Maker
Venn diagram generator
This Venn diagram maker creates Venn diagrams with many customization options, including two, three, or four circles, various colors, and different fonts and borders.
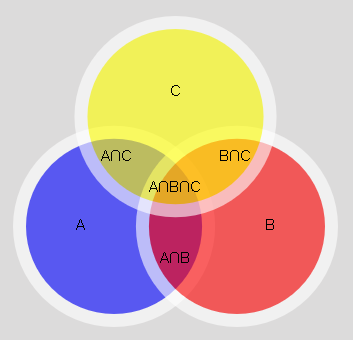
Venn diagram example
In this example each student can learn one or more of the following subjects:
Science, Physical education, and History.
If you press the 'Sample labels' button, and then 'Calculate', the Venn diagram maker will create a Venn diagram with names for every group and intersection.
If you press the 'Sample data' button, and then 'Calculate', the Venn diagram maker will create a Venn diagram with a list of items for every group and intersection.
If you press the 'Sample total' button, and then click 'Calculate', the Venn diagram maker will create a Venn diagram based on the quantities of items in the groups and intersections.
How to use the venn diagram maker:
The Venn diagram maker, used to create Venn diagrams with customizations.
1. Labels only:
- Use the Venn diagram maker as a presentation tool.
- Enter the label for each group and intersection.
- The maker will generate the Venn diagram, and you can customize it as desired.
2. Data list:
- Enter the list of objects for each group, and the Venn diagram maker will calculate all the intersections.
- In this case, the "Output" field will appear, and you can choose one of the following options:
- Number of data items: Shows the quantity in each group and intersection.
- Data list: Shows the items in each group and intersection.
- Item quantity and data list: Shows the number of items and the items in each group and intersection.
3. Number of data items:
- Enter the number of items in each group and intersection.
- For groups with subgroups, you can enter two numbers:
- All: The number of objects, including the subgroups.
- Only: The number of objects in this specific group.
- Each time you enter a number, the Venn diagram maker will check if it can calculate the number of items in any connected group or intersection based on the numbers you have already entered.
- If possible, it will calculate the number of items and show it in brown.
- The Venn diagram maker will display the calculation.
- After entering all the numbers, press the "Calculate" button, the Venn diagram maker will to generate the Venn diagram.
- It is possible to generate the diagram even if some of the data is missing. In this case, the diagram will only include partial numbers.
- The diagram will show only the number of items in the smallest groups.
- For example, if 'A∩B' exists but 'A∩B only' doesn't exist, it won't show any number.
Fields
- Title - Fill in the chart title and font size
- Subtitle - Fill in the chart subtitle and font size
- Input
Labels only
Data list
Number of data items - Output
Relevant only for the "Data list".
Number of data items
Data list
Item quantity and data list - Group - Enter name and choose the color. Fill in a space for the empty group name
- Intersection - Enter intersection name. Fill in a space for the empty intersection name
- Circles - Choose the number of circles in the Venn diagram.
- Background - Change the color of the diagram area.
- Border width - The cycle border. Fill zero for no border
- Border Color
Darker - The same color as the circle, but darker.
Darker level - Range: 0 to 100.
0 - the border color will be the same as the bar color
100 - the darkest possible color - black.
One color - Your chosen border color for all the circles.
Border color - choose the color. - Opacity - The circles' opacity
- Font - To customize the appearance of your text, choose font type, font size and color
- Download chart - Use the camera icon to download a PNG chart
- Circles overlap - You can control the level of circle overlap by adjusting a slider after generating the diagram.
- Text Distance - This is the text distance from the diagram center. You may increase the distance to improve clarity.
- Remove all intersection labels - When this feature is enabled, it excludes labels of intersections and shows only numbers.
- Remove mutually exclusive intersections - When this feature is enabled, it excludes labels and numbers of intersections that do not overlap.
- Remove bo group label - When this feature is enabled, it excludes the 'no group' label .
What is a Venn diagram?
A Venn diagram is a graphical representation of the relation between groups. Two circles partly overlap if some units will appear in both groups. If any unit appears only in one group, then the circles will not overlap.
How to create a Venn diagram.
- Determine the groups that your data contain.
- Determine which groups contain intersections, units that belong to more than one group.
- Draw a circle for each group with overlaps for intersections.
- Label each circle with the name of the corresponding group.
- Label the intersections.
What is the difference between Venn diagram and Euler diagram?
In a Venn diagram, when there is no overlap between groups, we show an empty intersection, while in an Euler diagram, there won't be any circle overlap.