ROC Calculator
Receiver Operating Characteristic curve online
Data: Use Enter as a delimiter; you may change the delimiters in 'More options'.
Score: Numbers.
Actual outcome: 0 (for negative) or 1 (for positive).
ROC Curve Calculator

How to use the ROC curve calculator
ROC curve calculator with optional Excel input, offering customization options such as fonts and colors. Multiple Receiver Operating Characteristic (ROC) curves simultaneously on a single graph.
Process
- Enter the data:
- Press the 'Calculate' button to get the results.
- Press the camera icon that appears when you hover over the chart to save the chart as an image.
How to enter data?
- Enter data in columns
- Enter the curve name, the default is 'Curve1'.
- Score - the score value used to predict the actual outcome.
- Actual outcome - the binary result that the model is trying to predict; it can be either 0 or 1.
- Enter the raw data separated by 'comma', 'space', or 'enter'. (*in you may copy only the data from excel).
- Enter data from Excel
- Copy Paste
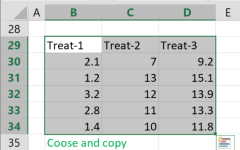
- a. copy the raw data with the header from Excel or Google sheets, or any tool that separates data with tab and line feed. copy the entire block, include the header .
- Paste the data in the input field.
- Import data from an Excel or CSV file.
When you select an Excel file, the calculator will automatically load the first sheet and display it in the input field. You can choose either an Excel file (.xlsx or .xls) or a CSV file (.csv).
To upload your file, use one of the following methods:- Browse and select - Click the 'Browse' button and choose the file from your computer.
- Drag and drop - Drag your file and drop it into the 'Drop your .xlsx, .xls, or .csv file here!' area.
Now, the 'Select sheet' dropdown will be populated with the names of your sheets, and you can choose any sheet.
- Copy Paste
Customization Options
The options already contains default values.
- Title - the title of the ROC curve, and the font size.
- Y-Axis - The default is 'True Positive Rate', but you can change it to other labels, such as 'TPR' or 'Sensitivity'.
The range of the y-axis is selected automatically, but you can adjust it manually if needed. - X-Axis - the default is 'False Positive Rate', you may change to other labels, such as 'FPR' or '1 - Specificity'.
The range of the x-axis is selected automatically, but you can adjust it manually if needed. - Costs - We cannot minimize both the false positive (FP) and false negative (FN) costs to zero simultaneously; therefore, we need to prioritize between them to choose the optimal threshold. To do this, we define the following costs:
FP Cost - The cost of a false positive.
FN Cost - The cost of a false negative.
For example, for a deadly disease, choose FP Cost = 1 and FN Cost = 30. - Rounding - how to round the results?
When a resulting value is larger than one, the tool rounds it, but when a resulting value is less than one the tool displays the significant figures. - Confidence Level (CL): - the confidence level of the AUC value. For the AUC test we calculate Significance level (α): as 1 - CL.
- Curve CI - Show or hide the AUC confidence interval in the 'Roc curve'.
- Plot Area - the background color of the region of the chart where the data is actually plotted.
- Chart Area - the background color of the entire area of the chart, including the plot area, titles, labels, and legends.
- Legend - the layout of the legend, vertical or horizontal
- Fonts - the type, size, and color of the fonts used for axes and the legend. The font color and type apply to all chart text.
- Curve line - show line, marker, or both. Solid or dashed line. Line width.
- Diagonal line - solid or dashed line; Line width; Line color.
- AUC - Font Size - the font size of the AUC label in the 'ROC Curve' or the Threshold value in the 'Cost Per Threshold'.
- AUC Line Spacing - the amount of vertical space between lines of text (AUC or Threshold) when displaying more than one curve.
- AUC X - the horizontal position of the AUC or Threshold label on the chart.
- AUC Y - the vertical position of the AUC or Threshold label on the chart.
- AUC X Alignment - the alignment of the AUC or Threshold label along the horizontal axis.
- Optimum Color – the color of the circle around the optimum point in the chart.
Darker – uses the same color as the curve, but darker by the 'Darker Level'.
One Color – selects a single color for the circle around the optimum point of all curves.
Darker Level – a value between -100 and 100, where -100 is the brightest color (white) and 100 is the darkest color (black). - Tick Interval – the distance or spacing between tick marks on the X-axis and Y-axis. Leave empty for automatic.
- Download Format – use the camera icon to download the chart.
Available formats: JPEG, PNG, SVG. The SVG format is recommended for the highest quality, as it does not lose quality at any image size. - Download Width and Height – number of pixels for the downloaded image's width and height.
- Enter data directly - delimiters:
When you enter the data manually the default is pressing Enter after any value, but you may use other delimiters.
What is ROC curve?
In a binary classifier model, the Receiver Operating Characteristic (ROC) curve plots the True Positive Rate (TPR) on the y-axis against the False Positive Rate (FPR) on the x-axis. This is done across different thresholds.
What threshold should be used?
There is no single threshold that is always optimal; the best choice depends on the specific application. There is a trade-off between maximizing the True Positive Rate (TPR) and minimizing the False Positive Rate (FPR), and the optimal threshold depends on the relative costs of false positives and false negatives.
For example, in the case of a deadly disease, the cost of a false negative (FN) is significantly higher than that of a false positive (FP).
An FN may lead to further transmission of the disease and result in additional deaths, while an FP may only cause unnecessary isolation.
In such cases, we may choose a threshold that maximizes the TPR, even at the expense of a higher FPR. When the costs of FN and FP are similar, we may choose the threshold that maximizes the following difference: TPR - FPR, known as the Youden Index.
Our ROC calculator lets you define the 'FN cost' and the 'FP cost', and then calculates the threshold that minimizes the total cost.
What is AUC?
The Area Under the Curve (AUC) is the area under the ROC curve. The AUC reflects how well the model performs compared to a random decision.
- AUC > 0.5 represents a model that is better than a random decision.
- AUC = 0.5 represents a poor model that is no better than a random decision.
- AUC < 0.5 represents a model that is worse than a random decision. It indicates that the direction of the decision is incorrect, and we should reverse the decision. In this case, the new AUC will be greater than 0.5 (New AUC = 1 - AUC).
For example, if the model states that a person is sick when the classification model result is greater than 244, we should change it to indicate that the person is sick when the classification model result is less than 244.
Compare AUC of independent ROC curves
You can compare the AUC of two independent ROC curves using the D statistic, which follows a t distribution with df degrees of freedom.
Welch-Satterthwaite equation
Compare AUC of paired ROC curves
You can compare the AUC of paired ROC curves using the Z statistic.
Glossary
Confusion Matrix
The calculator computes the confusion matrix and includes the confidence intervals for Sensitivity, Specificity, PPV, NPV, and Accuracy.
| PREDICTION | ||||
| ACTUAL | Positive (1) | Negative (0) | ||
| Positive (1) | TP | FN | Sensitivity (TPR) | |
| Negative (0) | FP | TN | Specificity (1-FPR) | |
PPV (Precision) | NPV | Accuracy | ||
- Classification model - predicts whether the event will happen or not, i.e., positive or negative.
- Positive - event happened.
- Negative - event did not happen.
- True Positive (TP) - the classification model predicted positive, and the event actually happened.
- False Positive (FP) - the classification model predicted positive, but the event did not happen.
- True Negative (TN) - the classification model predicted negative, and the event did not happen.
- False Negative (FN) - the classification model predicted negative, but the event actually happened.
- True Positive Rate (TPR), also called Sensitivity - the proportion of positive cases that the classification model identifies from the total positive cases.
- False Positive Rate (FPR), also equal to (1 - specificity), is the proportion of false positive cases that the classification model identifies from the total negative cases.
- Specificity, also called True Negative Rate (TNR), is the proportion of negative cases that the classification model identifies from the total negative cases.
- Accuracy - the proportion of correctly predicted cases from the total cases.
AUC Confidence Interval
n1 - sample size of the positive group (diseased group).
n0 - sample size of the negative group (non-diseased group).
SE calculation: we use the DeLong non-parametric method.[1].
For the confidence interval calculation, we assume a normal distribution.
AUC levels [2]
- 0.5: this suggests no discrimination, meaning the model performs no better than random chance.
- 0.5 - 0.6: is considered very poor.
- 0.6 - 0.7: is considered poor.
- 0.7 - 0.8: is considered acceptable.
- 0.8 - 0.9: is considered excellent.
- Greater than 0.9: is considered outstanding.