F Test Calculator
The F-test calculator compares the equality of two variances.
It also validates data normality, checks the test power, identifies outliers, provides formula and solutions, and generates the R syntax.
When you enter the raw data, the F-test calculator also provides the Shapiro-Wilk normality test result and identifies outliers.
F-test
The F-test calculator compares the variances of two populations by testing the null assumption that the variances of two populations are equal. It determines the F-test p-value, the effect size, and the confidence interval. When you enter the raw data, the F-test calculator also provides the Shapiro-Wilk normality test result and identifies outliers.
df₁ = n₁ - 1
df₂ = n₂ - 1
F test formula
The F-test formula uses the F-statistic as the ratio of sample variances. If the variances are equal, the F-statistic should be approximately one. If the variances are not equal, the F-statistic will differ from one. The degrees of freedom are the sample sizes minus one.
F-Test Assumptions
- Normality - Each population is normally distributed. The F-test for equality of variances is highly sensitive to deviations from normality.
- Independence - The two samples are independent of each other.
- Random Sampling - The observations in each group are randomly sampled from their respective populations.
What is a F-test for equality of two variances?
The F-test for equality of two variances, compares the variances of two populations. Under the null hypothesis, it is assumed that the variances are equal.
How to use the f test calculator?
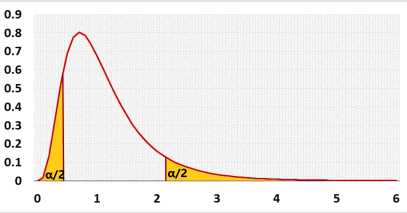
- Choose the tails:
The one-tailed test, left or right, is more powerful than the two-tailed test and results in a smaller p-value. You should choose it if only one direction is interesting, but the question of when to use the one-tailed test is controversial.
Two - the alternative hypothesis states that the variance of population-1 either smaller or bigger than the variance of population-2
Left - the alternative hypothesis states that the variance of population-1 smaller than the variance of population-2
Right - the alternative hypothesis states that the variance of population-1 bigger than the variance of population-2 - Significance level (α): A p-value less than the significance level is statistically significant.
Researchers usually use 0.05, but if the price of a mistake is big, they may use a smaller value like 0.01. - Outliers: extreme values. relevant only if you entered raw data.
included - the calculator will calculate the outliers but will include them in the calculation.
Excluded - The calculator will exclude the outliers before calculating the average and the standard deviation. - Advanced fields - for sample size
When planning the experiment, you should choose the effect size that the test should identify. You should choose the sample size before conducting the research. We added this field to alert users that didn't calculate the sample size, or did it incorrectly.
If you use the calculator for homework you may ignore these fields.
Effect - If you don't know the required effect size, you may use the 'effect' field. The default is 'Medium', if you change the value, it will change 'effect type' to 'Standardized effect size' and fill the proper value per Cohen's suggestion in the 'effect size' field. (Small:1.02, medium:1.15 , large:1.35 ) The calculator will not use this field when pressing the 'calculate' button.
The ratio of variances represents the effect size, which is the value you aim for the test to identify. To detect a smaller effect size, a larger sample size is required. - Rounding - how to round the results?
When a resulting value is larger than one, the tool rounds it, but when a resulting value is less than one the tool displays the significant figures. - How to enter data?
Enter summarized data: S₁, n₁, S₂, n₂ - use this option if you already have the sample measures (Usually homework).
a. Enter the names of the groups instead of "Group-1" and "Group-2", this is not mandatory.
c. Enter the sample standard deviations (S₁, S₂).
d. Enter the sample sizes (n₁, n₂).
Enter raw data directly - usually you have the raw data.
a. Enter the names of the groups.
b. Enter the raw data separated by 'comma', 'space', or 'enter'. (*you may copy the data from excel)
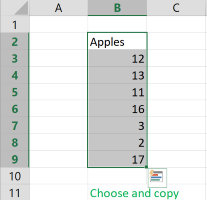
Enter raw data from excel - copy the raw data along with the header. This can be done from Excel, Google Sheets, or any tool that separates data with tabs and line feeds. Ensure that you copy the entire block, including the header.
The f-test calculator ignores empty cells and non numeric cells.