One Sample Variance Test Calculator
Chi-square test of a single variance, checks if the population variance (σ2) is different from the expected value (σ02).
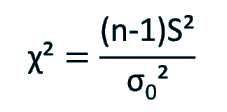
Chi-square test for the variance
Target: To check if the assumed variance (σ20) is statistically correct, based on a sample variance S2.
Identically check if the assumed standard deviation (σ0) is statistically correct, based on a sample standard deviation S.
Target: the chi-square test for the variance checks if the population variance (σ2) is different from the expected value (σ02). or check if the population variance is smaller/larger than the expected value.
Since the standard deviation is the square root of the variance, you may write "variance" or "standard deviation" when describing the test.
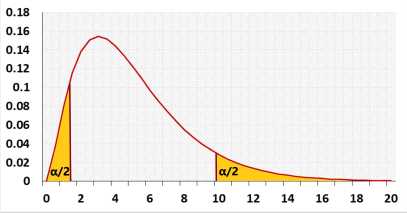
The two-tailed test is the default choice, check the null assumption that the variance equal σ20.
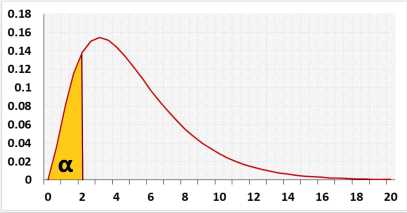
When you worried only if the standard deviation is bigger than the expected one, you may use the right-tailed test, to check only the following alternative hypothesis: σ>σ0, but this decision is controversial.
In this case, since it is possible to get also a smaller standard deviation some statisticians believe that you should use the two-tailed test.
How to use the one-sample variance test calculator?
- Choose the tails:
The one-tailed test, left or right, is more powerful than the two-tailed test and results in a smaller p-value, half since the t distribution is symmetrical. You should choose it if only one direction is interesting, but the question of when to use the one-tailed test is controversial.
Some statisticians advised that if the other direction is possible, you should use the two-tailed test. If you are confused, you may choose the safer option, a two-tailed test.
Two-tailed - the alternative hypothesis states that the population's standard deviation is either smaller or bigger than the expected standard deviation.
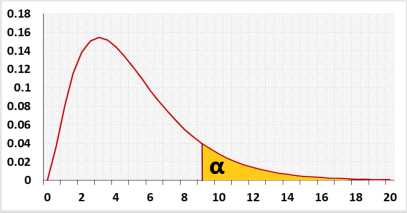
Left-tailed - the alternative hypothesis states that the population's standard deviation is smaller than the expected standard deviation.
Right-tailed - the alternative hypothesis states that the population's standard deviation is bigger than the expected standard deviation. - Significance level (α): A p-value less than the significance level is statistically significant.
Researchers usually use 0.05, but if the price of a mistake is big, they may use a smaller value like 0.01. - Outliers: extreme values. relevant only if you entered raw data.
included - the calculator will calculate the outliers but will include them in the calculation.
Excluded - The calculator will exclude the outliers before calculating the average and the standard deviation. - Advanced fields - for sample size
When planning the experiment, you should choose the effect size that the test should identify.
You should choose the sample size before conducting the research. We added this field to alert users that didn't calculate the sample size or did it incorrectly. If you use the calculator for homework you may ignore these fields.
Effect - If you don't know the required effect size, you may use the 'effect' field. The default is 'Medium', if you change it, The calculator will fill the proper value in the 'effect size' field.
Small: 1.1 - the test will identify variance that is greater by 10% than σ0.
Medium: 1.3 - the test will identify variance that is greater by 30% than σ0.
Large: 1.5 - the test will identify variance that is greater by 50% than σ0.
We didn't find any reference to the magnitude, it is only a rule of thumb.
The calculator will not use this field when pressing the 'calculate' button.
Effect size - the value that you want the test to identify. You need a larger sample size to detect a smaller effect size. - Expected standard deviation - this is the null assumption value.
- How to enter data?
Enter summarized data: SD, n - use this option if you already have the sample measures (Usually homework).
a. Enter the name of the group instead of "Group-1" (not mandatory).
b. Enter the sample standard deviation.
c. Enter the sample size (n).
Enter raw data directly - usually, you have raw data.
a. Enter the name of the group.
b. Enter the raw data separated by 'comma', 'space', or 'enter'. (*you may copy only the data from excel)
Enter raw data from excel - copy the raw data with the header from Excel or Google sheets, or any tool that separates data with tab and line feed. Copy the entire block, and include the header.
*When having only one column, like in one sample variance test calculator, the difference between the last two options is minor, but we prefer to use the same format along with the website.
The one sample variance test ignores empty cells and non-numeric cells.
Assumptions
- Independent observations (no repeated measure).
- The data is continuous (ratio or interval).
- The data distribution is normal.
- The population expected variance is known.
Required Sample Data
- Sample standard deviation (S).
- Sample size (n).
Effect size formula
Phi (φ) effect size
| φ = √( | χ2 | ) |
| n |
Examples
A factory uses a machine to create screws. The standard deviation is 0.1mm. Recently the engineers upgraded a big module in the machine.
The quality assurance manager is interested to know if there was a change in the standard deviation of the diameter of the screws.
1. A two-tailed test example:
If the standard deviation is higher than 0.1mm, then the engineer must fix it to meet the expected quality.
If the standard deviation is lower than 0.1mm, the sales may consider selling the screws at a higher price.
2. Right-tailed example:
In this example, the quality assurance manager doesn't care if the standard deviation is lower than 0.1mm, only that the standard deviation must not exceed 0.1mm.
The use of a one-tailed test in this example is controversial.