One way ANOVA test
What is the ANOVA test?
The ANOVA test checks if the difference between the averages of two or more groups is significant, using sample data.
ANOVA is usually used when there are at least three groups, since for two groups the two-tailed pooled variance t-test and the right-tailed ANOVA test have the same result.
The basic ANOVA test contains only one categorical variable — one-way ANOVA. For example, if you compare the performance of three schools, the categorical variable is school, and its possible values are School-A, School-B, School-C. There are more complex ANOVA tests that contain two categorical variables (Two-way ANOVA calculator), or more.
When performing a one-way ANOVA test, we try to determine if the difference between the averages reflects a real difference between the groups, or is due to the random noise inside each group.
The F statistic represents the ratio of the variance between the groups and the variance inside the groups. Unlike many other statistical tests, the smaller the F statistic the more likely the averages are equal.
Example: compare four fertilizers used in four fields.
H0: The average weight of crops per square meter is equal in all fields.
H1: At least one field yields a different average per square meter.
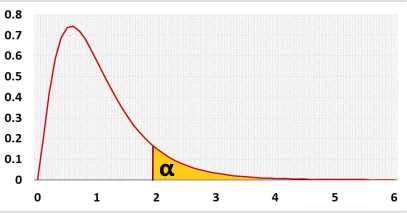
Right-tailed — for the ANOVA test you can use only the right tail. Why?

Assumptions
- Independent samples
- Normal distribution of the analyzed population
- Equal standard deviation, σ1=σ2=...=σk
The assumption is more important when the groups' sizes are not similar
Required Sample Data
- Sample data from all compared groups
Parameters
- k - Number of groups
- ni - Sample size of group i
- n - Overall sample size, includes all the groups (Σni, i=1 to k)
- x̄i - Average of group i
- x̄ - Overall average (Σxi,j / n, i=1 to k, j=1 to ni)
- Si - Standard deviation of group i
Results calculations
| Source | Degrees of Freedom | Sum of Squares | Mean Square | F statistic | p-value |
|---|---|---|---|---|---|
| Groups (between groups) | k - 1 | 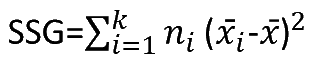 | MSG = SSG / (k - 1) | F = MSG / MSE | P(x > F) |
| Error (within groups) | n - k |  | MSE = SSE / (n - k) | ||
| Total | n - 1 | SS(total) = SSG + SSE | Sample Variance = SS(total) / (n - 1) |
How to use the ANOVA calculator
- Enter the data — one column per group; type directly or paste from Excel. Use + Column and - Column for more or fewer groups.
- Type values directly into the grid; press Enter for a new row. New rows are added automatically once you reach the last one.
- Paste data copied from Excel. (tab-delimited)
- Paste data with another delimiter (comma, space, or custom) by enabling it under More options.
- Open More options to set the rounding, outliers policy and the expected effect size (for the a-priori power).
- Press Calculate.