Sample Size Calculators
A larger sample size generates more accurate results, but it may be more expensive.
You may calculate the sample size based on the required margin of error of the confidence interval or based on the required test power or using a rule of thumb.
Required Confidence Interval
The calculator determines the sample size to gain the required margin of error (MOE).
Confident Interval = Estimated value ± MOE .
A larger sample size reduces the margin of error.
Required Test Power
The calculator determines the sample size to gain the required test power and draw the power analysis chart.
A larger sample size increases the statistical test power.
Researchers usually use the power of 0.8 which mean the probability of type II error (β), failure to reject an incorrect H0.2, is 0.2. The commonly used significance level (α) is 0.05. β is usually four times bigger than α, since rejecting a correct null assumption consider to be more severe than failing to reject a correct invalid assumption.
Power Analysis Chart
The calculators create the following dynamic chart. When using the calculators, you may hover over any column any see the test power for each sample size.
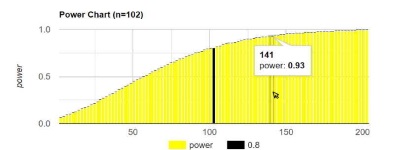
The chart shows the power per each sample size.
The black bar shows the sample size that achieves the required power. In this example 102 achieves the power of 0.8.
When you hover over the power chart in the calculator, you may see the sample size and the power it achieves. In this example a sample size of 141 achieves the power of 0.93.