P-Value
P value definition
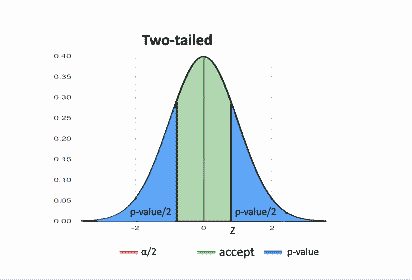
The p-value is the type I error probability, to reject a correct H0, under the assumption that H0 is correct.
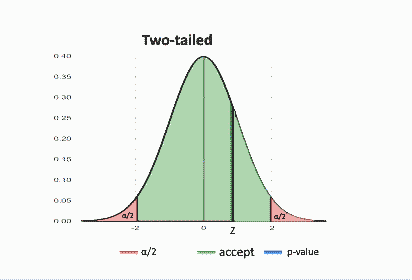
When the p-value is small enough, less than α, the risk of type I error is low, and we reject the H0.
In the following two-tailed example the p-value is greater than α hence we can not reject the null assumption.
Please click the "P-Value" radio button.
Is only p-value important?
Every student learns how important it is to get a significant result, but the p-value is only one component in a package.
The "power" and "effect size" are not less important.
All the below examples are fake, the made-up data was created only for demonstration. The used significance level is 0.05.
Example - High blood pressure
Several researchers looked for high blood pressure treatment.
1. Garlic helps 
The test power was very strong 0.996, to discover a medium effect size of 0.5.
| Result | Value |
|---|---|
| P-value | 0.0071 |
| Sample size | 114 |
| Test Power | 0.9964 |
| Standardized effect size | Small, 0.26 |
| Difference | -0.109 |
Data
x2 <-c(144.5,155.5,160.4,170.4,158.1,160.3,162.2,153.1,141,132.8,121.8,134.2,125.7,127.3,144.3,125,122.4,135.6,144.1,154.5,160.5,131.7,121.7,132.9,146.6,121.5,134.4,138.8,133.3,121.1,119.6,141.2,155.8, 167.1,132.2,143.9,152.3,155.7,145.5,154.6,159.9,170.1,157.8,160.3,162,153.3,141.1,133.2,121.7,133.8,126,127,143.7,124.9,121.6,136.3,143.8,155,160.7,132.3,121.8,132.9,146.5,122.1,133.7,138.7,132.6,121.5,119.7,140.9,156.3,167.4,131.6,144.2,151.9,156.5,145,155.1,160,170.4,157.8,159.9,161.7,153.2,140.5,133.2,122,134.2,126.3,126.6,143.6,124.8,122.5,135.7,144,155.3,161.2,132.5,122,133.3,146.9,122.1,133.9,138.8,132.6,120.5,120.1,140.8,156.4,166.9,131.8,144.1,152.2,156.4)
t.test(x1, x2, alternative = "two.sided", paired = TRUE, mu = 0, conf.level = 0.99)
2. Daily exercise doesn't help
| Result | Value |
|---|---|
| P-value | 0.06 |
| Sample size | 5 |
| Test Power | 0.034 |
| Standardized effect size | large, 1.1 |
| Difference | -2.1 |
The standardized effect size is large (1.1), and the unstandardized effect size is meaningful (2.1), reducing blood pressure by 2.1 mmHg.
Data
x2<-c(144.6,155.6,162.3,170.6,161.1)
t.test(x1, x2, alternative = "two.sided", paired = TRUE, mu = 0, conf.level = 0.99)
3. The seven dwarfs believe in onion 
When they reached the age of 140, they started suffering from high blood pressure. Since their mother used to tell them that onion cures any disease, each of them decided to conduct research, without telling his brothers.
Each dwarf uses a sample size of 114. Following the results:
| Dwarf | P_value |
|---|---|
| Doc | 0.09 |
| Grumpy | 0.049 |
| Happy | 0.25 |
| Sleepy | 0.17 |
| Bashful | 0.31 |
| Sneezy | 0.22 |
| Dopey | 0.39 |
Grumpy publish an article in the "Nature Medicine" Journal.
Does onion help to reduce blood pressure? Multiple comparisons
Conclusion
If you need to choose one of the three treatments, what would you choose?Onion?
The sample size that each dwarf used was large, and most of the studies concluded the onion doesn't help. I wouldn't try the onion ...Garlic or daily exercise?
The garlic treatment is significant, but the effect size is very small, it isn't a useful treatment.
The daily exercise treatment is not Significant, but there are several reasons to prefer this treatment.
1. The test power is weak, hence the test may not have enough power to reject an incorrect null assumption. We can't know if the result is significant.
2. The p-value 0.06 is larger than the significance level 0.05, but 0.05 is not a "holy" number. You may choose a different significance level like 0.1 or 0.01 if you decided before the experiment that this is the appropriate risk. Usually, you don't have the freedom to choose the α when all the researchers in your field use the same value.
3. The effect size is large, so if H0 is correct, there is a small probability, 0.06, that the treatment doesn't help, but if it helps, there is a high chance that it is a meaningful reduction.
The correct solution is to repeat the daily exercise research with larger a sample size.
| Result | Garlic | Exercise |
|---|---|---|
| P-value | 0.0071 | 0.06 |
| Sample size | 114 | 5 |
| Test Power | 0.9964 | 0.034 |
| Standardized effect size | Small, 0.26 | Large, 1.1 |
| Difference | -0.109 | -2.1 |