Wilcoxon Signed Rank test calculator
Two dependent samples, non-parametric paired test. The test compares the probability to get higher value from group₁ with the probability to get higher value from dependent group₂. For independent samples go to Wilcoxon rank-sum test calculator.
The Wilcoxon Signed-Rank calculator calculates the Wilcoxon Signed-Rank W and p-value. When you enter raw data, the wilcoxon test online also calculates the Shapiro-Wilk normality test and calculates the outliers.
Difference = Right column - left column.
The paired t-test calculator doesn't count empty cells or non-numeric cells.
Wilcoxon Signed-Rank


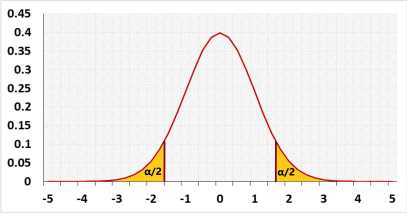
Left tail, or two tails with negative Z, (W- < μ) , C = 0.5 .
What is a Wilcoxon Signed-Rank test?
The Wilcoxon Signed-Rank test is a non-parametric test for paired samples. Like other nonparametric tests, the Wilcoxon Signed-Rank test does not make any assumptions about the distribution of the differences, particularly no normal assumption. The pairs are usually same subjects in two different conditions. or any others connection between the two samples when there is a one to one connection between the samples - each value in one group is connected to one value in the other group. The test compares the positive ranks of the differences to the negative ranks of the differences.
Unlike the paired t-test, which compares the mean of the differences to the expected difference, the Wilcoxon Signed-Rank test compares the probability that a random value from Group 1 is greater than its dependent value from Group 2. When the two distributions have a similar shape, it is similar to comparing the median of the differences to the expected difference. When the two distributions have a similar symmetrical shape, it is similar to comparing the mean of the differences to the expected difference. more
Wilcoxon Signed-Rank assumptions
Since the Wilcoxon Signed-Rank test is a nonparametric test, it does not make assumptions regarding the distribution of the data, only that the differences between the paired observations are ordinal, which means that the data can be ranked or put in order. Additionally, the test assumes the regular sampling assumptions."
- Dependency in groups: pairs of data, each subject in one group has one dependency to one subject in the other group.
- Independence: The observations within each group must be independent of one another.
- Random sampling: The observations in each group should be randomly sampled from their respective populations.
- Ordinal data: The data being analyzed should be ordinal or continuous.
What is wilcoxon test calculator?
It could refer to the Wilcoxon Signed-Rank calculator for paired samples, this calculator, or Wilcoxon rank-sum test calculator for independent samples.
Critical value in discrete distribution
In continuous distribution P(x=X) approaches zero, but this is not the case in discrete distribution. p(x≤X)+p(x≥X)=1+p(x=X)
p(x≥X)=1-p(x≤X)+p(x=X)=1-p(x≤X-1)
p(x≥X)=1-p(x≤(X-1))
How to use the Wilcoxon Signed-Rank online?
How to enter data?
- Enter raw data directly - enter the raw data separately for each column. You may copy from excel, or enter one by one separate with comma or enter.
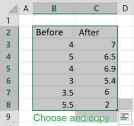
- Enter raw data from excel - copy the entire block
Methods
- Automatic: When the number of non-zero pairs (n) is less than or equal to 40 and the data does not have ties, the tool uses the exact calculation. Otherwise, the tool uses the z approximation.
- Exact: When the number of non-zero pairs (n) is less than or equal to 40, the tool calculates the probability based on all possible combinations. Otherwise, the tool uses the z approximation.
- Z approximation: The tool always uses the z approximation.
Effect size
The standardized effect size
| r = | z |
| √n |
When the Wilcoxon signed-ranks calculator uses the normal approximation, it calculates Z as part of the approximation. Whether or not the continuity correction is included in Z depends on what you entered in the corresponding field. When the calculator uses the 'exact' method, it calculates the exact probability of the observed test statistic. In this case, the calculator calculates the z-score from the exact probability.
The common language effect size
This is the probability that a random value from Group1 is greater than his dependent value from Group2.| f = | W |
| W- + W+ |
W- + W+ = 1 + 2 + ... + n.
Using the arithmetic sequence formula
| W- + W+ = | n(n + 1) |
| 2 |
| f = | 2W |
| n(n + 1) |
Two-tailed Wilcoxon signed-rank test example:
Fifteen people are given treatment to reduce their cholesterol levels, with an expected reduction of 10mg/dL. The distribution of the reduction is not normal, and the researcher takes two measures for each person before and after the treatment.
Both higher and lower reductions are of interest.
Before: 178.38, 265.58, 215.45, 159.17, 168.49, 215.02, 127.31, 125.31, 174.73, 180.16, 160.29, 231.31, 273.79, 174.13, 192.42
After: 183.47, 263.89, 228.14, 174.25, 183.91, 230.55, 135.92, 123.86, 195.75, 196.15, 163.95, 242.26, 298.73, 202.99, 217.66
Right-tailed Wilcoxon signed-rank test example.
Is the treatment for pattern hair loss effective in increasing hair density (measured in hairs per square cm)? We check the same person before and after six months of treatment.
The distribution of improvement is not normal. We know that the treatment cannot increase hair loss.
The question of when to use a one-tailed test is controversial. Before using a one-tailed test, you need to check it carefully, otherwise you may double the probability of making a Type I error. In this example, you may use the one-tailed test since you have preliminary knowledge that the treatment cannot increase hair loss." H0: the results before and after the treatment are identical.
H1: there is higher hair density after the treatment.
