How to make a heatmap
- Chart type: pick a flat (2D) heatmap of squares or circles, or a 3D heatmap with a column on each cell.
- Data: type or paste your table: the row names in the first column, the numbers beside them, the column names in the header. Or open an Excel or CSV file.
- Design & download: pick a color scale and a style, show or hide the numbers, then download a PNG or SVG, or save the heatmap in a .heat file to keep editing later.
What is a heatmap?
A heatmap is a table drawn as colors. Each number of the table becomes one colored cell: a small number gets a pale color, a big number a strong one. So you see at once where the numbers are high, where they are low, and the patterns between them.
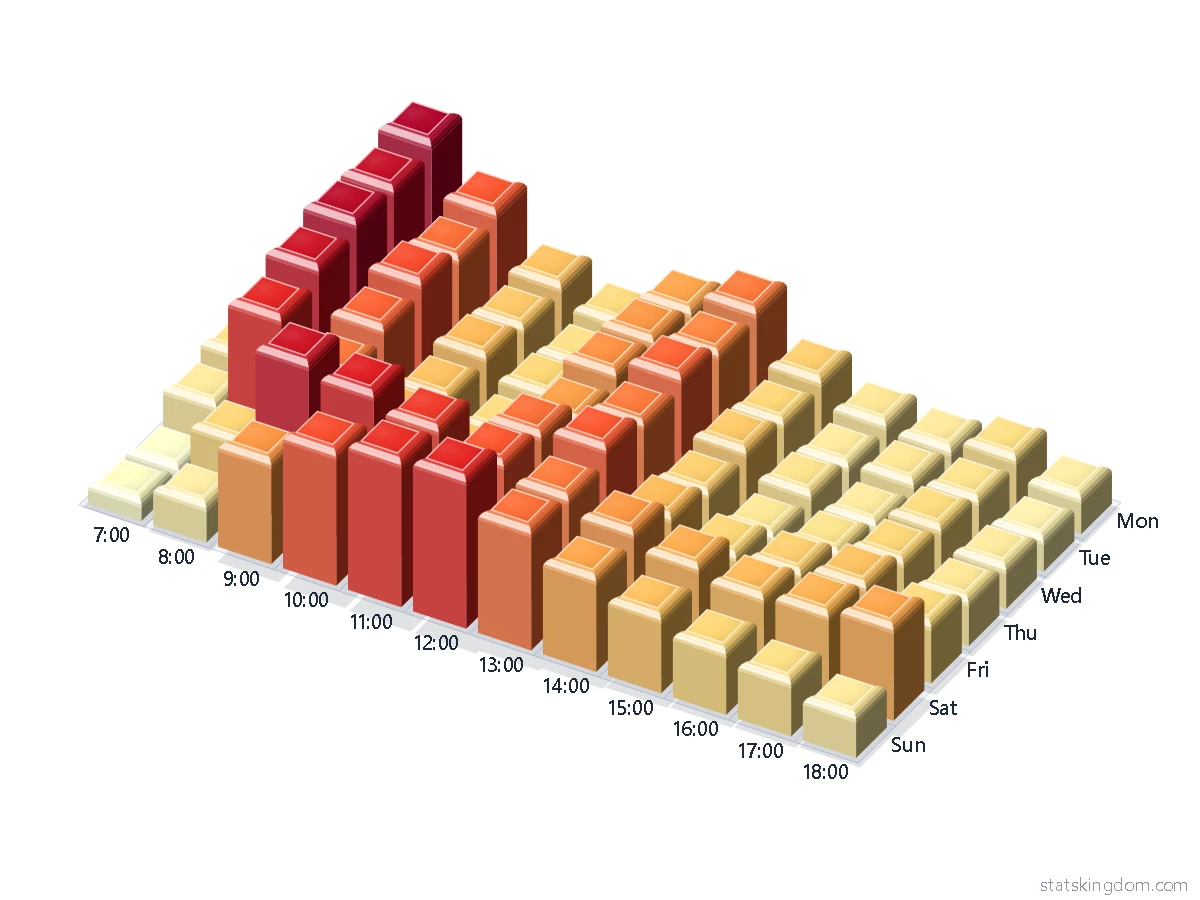
Example 1 is a coffee shop: customers for each day of the week and each hour. The darkest cells are 8:00 on weekdays and the late morning on Saturday. Example 2 is a correlation table of a sleep and mood survey (example data): blue for a negative correlation, red for a positive one, white near 0. More sleep goes with a better mood, more stress with a worse one.
How to read a heatmap and pick its colors
Read the colors first, then the numbers. The legend, the color bar beside or under the heatmap, tells which color means which number.
- One-direction scales (Heat, Blues, Greens, Purples, Greys, Viridis, Magma, Sunset) go from a pale color for the smallest number to a strong color for the biggest. Use them for amounts: counts, sales, hours, scores.
- Two-side scales (Blue–White–Red, Purple–White–Green, Brown–White–Teal, Red–Yellow–Green) have a light color in the middle. Use them when the numbers go above and below a middle, for example a correlation from −1 to 1, or a change from last year. Set Range to Middle at 0, so that 0 gets the middle color.
- Color each row or each column gives every row (or column) the whole scale. One row of big numbers then does not make all the other rows pale, and you see where each row is high and where it is low. The legend then says Low and High instead of numbers.
- Steps puts the numbers in 3 to 9 color bands. Bands are easier to compare by eye than smooth shades.
- For readers who are color-blind, Viridis, Magma, Blues and Brown–White–Teal are safer than Red–Yellow–Green. Greys prints well in black and white.
How to make a heatmap in Excel
Excel colors the cells of the table itself, with conditional formatting (Excel for Microsoft 365, Excel 2016 to 2024 and Excel for the web):
- Select the cells with the numbers (not the names).
- On the Home tab, in the Styles group, click the arrow next to Conditional Formatting, then Color Scales, and pick a scale. Excel has two-color and three-color scales.
- To change the colors: Conditional Formatting > Manage Rules, select the rule, click Edit Rule, and pick a color for the lowest, the middle and the highest values.
The cells keep their numbers and Excel paints them. For a picture with the names, a color legend and a title, or a 3D heatmap, paste the same table into this page.
2D or 3D heatmap?
A flat (2D) heatmap is the one to read exact values from: every cell is the same size, the numbers fit inside, and nothing hides anything else. Use it for reports and papers.
A 3D heatmap puts a column on each cell, as tall as its number, so the big numbers stand out twice: by color and by height. It is good for slides and for showing the shape of the data. In 3D a tall column can hide part of the columns behind it: change Turn and Tilt to see them, and keep the table small (3D draws up to 25 × 25 cells, 2D up to 60 × 60).
2D circles also show each number twice: by the circle's color and by its size (with Size by value). A bigger number gets a bigger circle.
Frequently asked questions
Is this heatmap generator free? Do I need an account?
It is free, and there is no sign-up or login. The small statskingdom.com mark in the corner of the chart can be removed, or changed to your own name, in the Watermark box.
Can I use negative numbers?
Yes. Use a two-side scale (for example Blue–White–Red) with Range set to Middle at 0, so that 0 gets the middle color. In 3D, the column of a negative number goes down from the floor.
What happens to empty cells, or cells with words?
An empty cell, or a cell with a word in it, is drawn grey with a dash and is left out of the colors. A note under the chart counts the cells with words. A row with no number at all is left out.
How many rows and columns can a heatmap have?
Up to 60 rows and 60 columns in 2D, and 25 × 25 in 3D. With more, the first ones are drawn and a note says so. When the cells are too small for their numbers, the numbers are left out (a note says so); make the chart bigger, or choose Text size Small.
How do I make a correlation heatmap?
Work out the correlation table first, for example with the correlation calculator or with R's cor(), and paste it here with the variable names in the first column and in the header. Choose Blue–White–Red and Range Middle at 0. Example 2 is such a table.
Can I save my heatmap and keep editing it later?
Yes. Save, under the chart, puts your table and all your settings into a .heat file on your computer; Open brings it back here. Nothing is uploaded. This browser also keeps your last heatmap: the Last run button in step 2.
What can I download?
A PNG picture (twice the size of the chart on the screen), an SVG file that stays sharp at any size and opens in Word, PowerPoint and Inkscape, or Copy, which puts the picture on the clipboard.
If you like the page, please share or like it. Questions and suggestions are welcome at [email protected]. No reply? Check your spam folder.