How to make a funnel chart
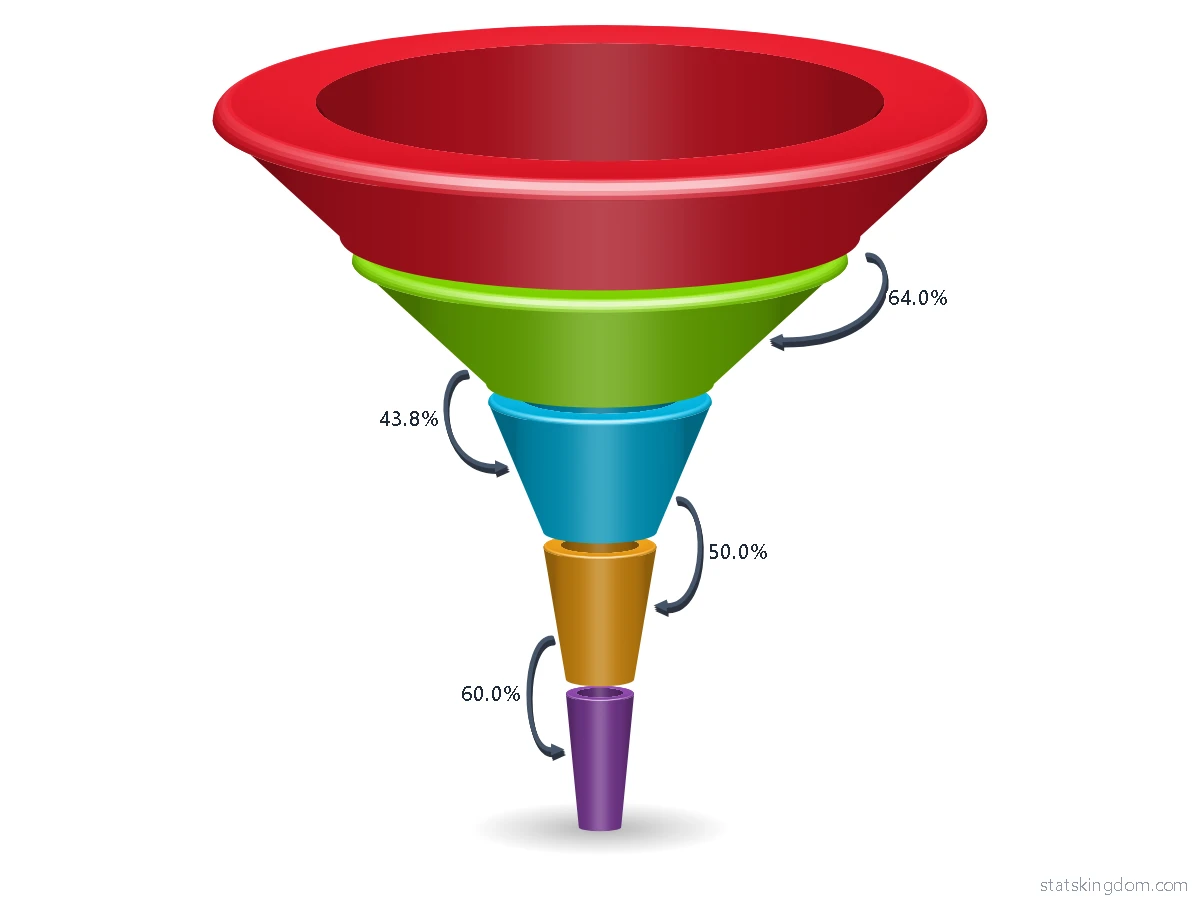
- Pick a funnel. In step 1 choose a flat funnel, flat steps, a 3D funnel or a 3D funnel whose layers are rings.
- Add your data. Put the stages in the first column, from the top of the funnel down, and the number at each stage in the second. Type over the example, paste cells from Excel or Google Sheets, or open an Excel or CSV file.
- Design and download. In step 3 choose a style, the light, the gap between the layers, the labels, arrows, the colors and the background, then download the chart as a PNG picture or an SVG file, or copy it straight into Word, PowerPoint or Google Slides.
What is a funnel chart?
A funnel chart shows how a number gets smaller as it passes through the stages of a process. Each stage is one layer. The first stage is at the top and the last at the bottom, and each layer is as wide as its number, so the chart narrows like a funnel.
It is used wherever people or things drop out step by step: visitors who become buyers on a website, people who apply for a job and the few who are hired, leads in a sales pipeline, or patients at each stage of a study. Example 1 on this page is an online shop in one week: 5,000 visitors, 3,200 viewed a product, 1,400 added it to the cart, 700 went to the checkout and 420 bought. Example 2 is hiring for one job: 250 applications, 90 phone calls, 40 interviews, 8 offers and 6 people hired.
Two percents describe each stage. The percent of the first stage tells how much of the start is left: 420 of 5,000 is 8.4%. The percent of the stage above, also called the conversion rate of that step, tells how many went on from one step to the next: 1,400 of 3,200 is 43.8%. The labels can show both, and the arrows can show the step percents.
How to create a funnel chart in Excel
Excel has a funnel chart of its own in Microsoft 365 and in Office 2021 and later, on Windows and on the Mac.
- Put the stages in one column and their numbers in the next column, the first stage at the top.
- Select both columns.
- On Windows, select Insert > Insert Waterfall, Funnel, Stock, Surface or Radar chart > Funnel. On a Mac, select the Insert tab, then the Waterfall icon, then Funnel.
- Change the colors, the labels and the title on the Chart Design and Format tabs. If you do not see them, click anywhere in the chart.
Older versions of Excel have no funnel chart. There you can build one from a stacked bar chart with two series: the first is half of (the largest number minus the stage's number) and has no fill, so it pushes each bar to the middle; the second is the stage's number. Put the stages in reverse order on the axis, so the first stage is at the top.
This page makes the same chart with no Excel at all, and also draws it in 3D, with layers that are rings, arrows between the layers and twelve styles.
When to use a funnel chart
- For stages that follow each other, where each stage holds part of the one before it: a visitor must view a product before adding it to the cart.
- To find the step that loses the most. The step percents show it at once: in Example 1 only 43.8% of the people who viewed a product added it to the cart, the lowest step.
- Not for groups that are not steps of one process, such as sales in each country. Use a bar chart, or a pie chart for the parts of a whole.
- Not to compare numbers that are close. Widths are hard to compare by eye; show the numbers in the labels, or use a bar chart.
- A layer can be bigger than the one above it (people who join half-way). The page draws it wider and says so in a note under the chart, but then the data are not a true funnel.
Frequently asked questions
Is this funnel chart maker free? Do I need an account?
It is free, and there is no sign-up or login. The small statskingdom.com mark in the corner of the chart can be removed, or changed to your own name, in the Watermark box.
Can I make a 3D funnel chart?
Yes. In step 1 choose the 3D funnel, or the 3D funnel with a hole, where each layer is a ring. In step 3 the Tilt box sets how much of the top of each layer you see, and you can choose the light, rounded edges and a shadow or a reflection under the funnel.
How do I show the conversion rate between two stages?
Choose arrows in step 3: between the layers, on the right, on both sides by turns, or one arrow from the first layer to the last. Each arrow can show the percent of the layer above or of the first layer. The labels can also show "% of previous".
Why is one layer wider than the layer above it?
A layer is as wide as its number, so a bigger number draws a wider layer, and a note under the chart says so. If you want every layer a little narrower than the one above whatever the numbers, choose Width "Even": the numbers still show in the labels.
Can I change the color of one layer?
Yes. Under Layer colors in step 3 every layer has its own color box. The Palette colors button puts them all back on the palette, and the Shades palette colors the whole funnel in shades of one color.
What can I download?
A PNG picture for documents and slides, an SVG file that stays sharp at any size, or Copy image to paste the chart straight into Word, PowerPoint or Google Slides. Your data stays in your browser.
If you like the page, please share or like it. Questions and suggestions are welcome at [email protected]. No reply? Check your spam folder.