How to create a Sankey diagram
- Pick a look. In step 1 choose one of six looks: ribbons that fade from one color to the next, grey ribbons, ribbons in the color of where they start or where they end, wide blocks with the names inside, or fine straight lines.
- Add your flows. Each row of the table is one flow: where it comes From, where it goes To, and its Value. Type over the example, paste cells from Excel or Google Sheets, or open an .xlsx, .xls or .csv file.
- Design and download. In step 3 change the nodes, the ribbons, the colors, the labels and the background, then download the diagram as a PNG picture or an SVG file, or copy it straight into Word, PowerPoint or Google Slides.
What is a Sankey diagram?
A Sankey diagram shows how an amount flows from one set of things to another. Each thing is a node, drawn as a colored bar, and each flow is a ribbon between two nodes. The width of a ribbon is its amount, so the widest ribbons are the biggest flows, and a node is as tall as everything that flows through it.
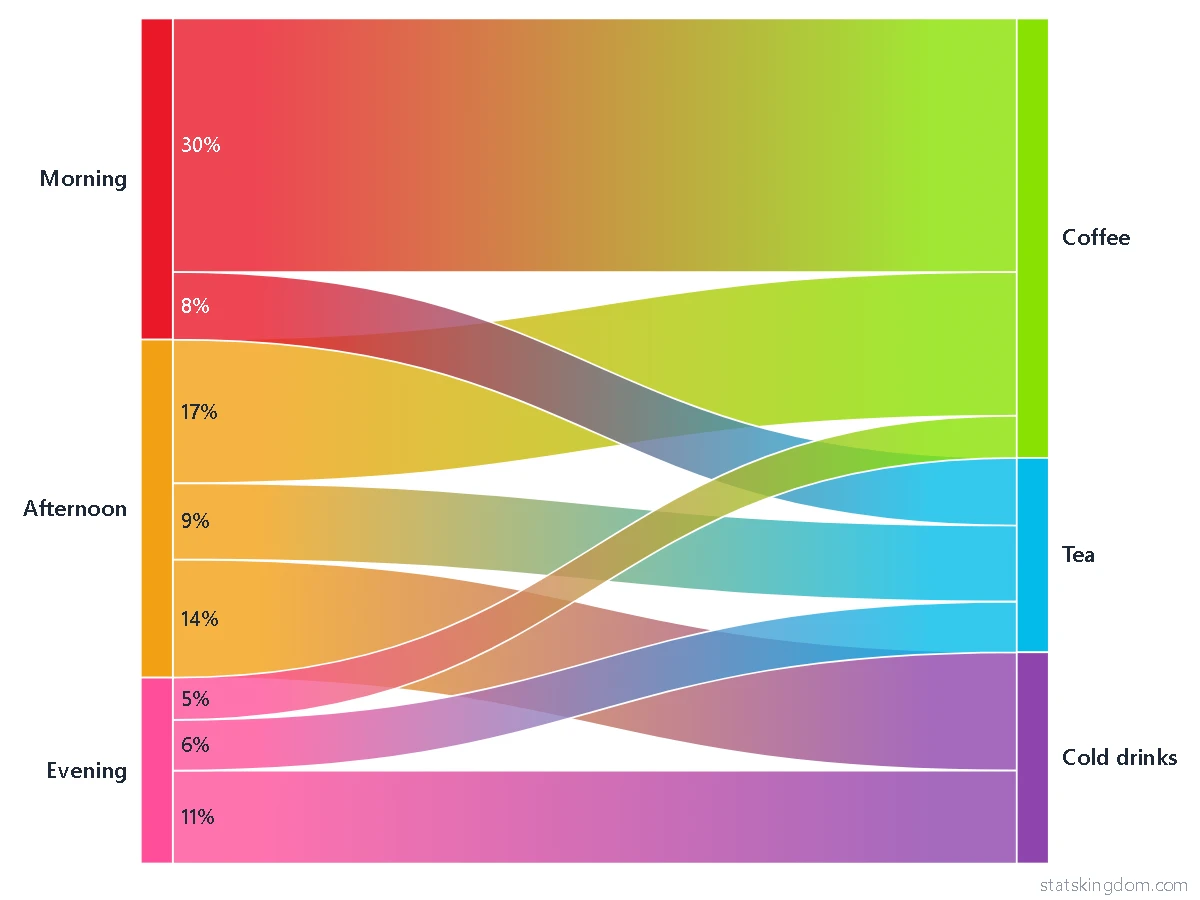
The diagram is read from left to right. A node on the left only sends, a node on the right only receives, and a node in the middle receives from the left and sends on to the right, so a diagram can have two columns of nodes or many. Example 1 draws the drinks a café sold in one day, from the time of day to the kind of drink; Example 2 draws a month's budget, from the income, through the budget, to what the money was spent on.
When to use a Sankey diagram
- Use it when something splits and merges on its way: a budget that goes to rent, food and savings, energy from its sources to its uses, visitors moving from page to page, votes moving between parties, customers moving between plans.
- One number for each flow. The width of a ribbon is its amount, so the biggest flows are easy to see and to compare by eye.
- Keep it small. A few steps and ten to twenty nodes read well. With many nodes the names crowd, and a table or a bar chart is clearer.
- Use a bar chart instead when you only compare totals, or when readers need the exact value of every item: ribbons are easy to compare roughly, not exactly.
- For the parts of one whole, with no flow from one step to the next, use the pie chart maker.
How to lay out the data
The table has three columns: From, To and Value. Each row is one flow, one ribbon.
- The same name is the same node. Write “Coffee” in two rows and both ribbons meet at one node. Capital letters count: “Tea” and “tea” are two nodes, and a note under the chart points out names that differ only by capital letters.
- A name in two steps needs a name for each, such as “Yes 2020” and “Yes 2021”. With the same name in both steps they would be one node, and a flow from “Yes” to “Yes” would be left out.
- Rows with the same From and To are added up. If the Value column is empty in every row, each row counts as 1, so a pasted list of pairs is counted.
- A row is left out if it has no From or To name, no number, a number of 0 or less, or the same name in From and To. A note under the chart says how many.
- A flow goes one way. A row that would close a loop, such as A to B, B to C and C to A, is not drawn, and the note names its row.
- The diagram can have up to 100 names and 1,000 rows; a note says when more were left out.
- In a standard Sankey diagram, what flows into a middle node equals what flows out of it. If your table does not say so, a note names those nodes. The diagram is still drawn as you entered it.
Looks and settings
Step 1 offers six looks: Gradient (ribbons that fade from the color of one node to the next), Classic (grey ribbons), From colors and To colors (a ribbon takes the color of the node it leaves, or of the one it reaches), Blocks (wide nodes with their names inside) and Fine lines (thin straight ribbons). A look only sets a few boxes, and every box can be changed in step 3.
- Numbers. Ribbons and nodes can show the value, the percent, or both. A ribbon's number can stand at its start, at its end, in its middle, or at both ends. A percent is a share of everything that enters the diagram, or of the node at that end of the ribbon.
- Order and position. Automatic looks for the order in which the fewest ribbons cross; As in the table and Biggest first are the other two. Position sets how the nodes of a column stand: at the top, in the middle, or spread over the whole height.
- Colors and shape. Seven palettes, a color box for each node (Node colors), and plain, pattern and picture backgrounds. Picture shape makes the diagram standard, wide, square or tall, for a slide or a page.
Move things, retype and add text
Press Edit under the chart. Drag a node up or down and its ribbons follow. Drag the title, the legend, a name or a number to move it, or drag a ribbon to move the whole diagram; choose the diagram and drag a corner square to make it smaller. Click a word twice to retype it, or choose a name or a number and press F2: a node's name is changed in every row of the table. Add text puts your own words on the chart, and the color box colors any text. Undo takes back the last change, and Reset positions puts everything back where the page placed it.
How to make a Sankey diagram in R
The R code button under the chart writes R code for the table on the screen. It uses the networkD3 package (install it once with install.packages("networkD3")) and opens the diagram in the RStudio Viewer or in your browser. This is the code for Example 1:
# Sankey diagram with the networkD3 package (install it once: install.packages("networkD3"))
library(networkD3)

# One row for each flow: where it comes from, where it goes to, and its value
links <- data.frame(
  from  = c("Morning", "Morning", "Afternoon", "Afternoon", "Afternoon", "Evening", "Evening",
            "Evening"),
  to    = c("Coffee", "Tea", "Coffee", "Tea", "Cold drinks", "Coffee", "Tea", "Cold drinks"),
  value = c(60, 16, 34, 18, 28, 10, 12, 22),
  stringsAsFactors = FALSE
)

# One row for each node, in the order of the table. "group" only names the color of the node.
nodes <- data.frame(
  name  = c("Morning", "Coffee", "Tea", "Afternoon", "Cold drinks", "Evening"),
  group = c("n1", "n2", "n3", "n4", "n5", "n6"),
  stringsAsFactors = FALSE
)
links$source <- match(links$from, nodes$name) - 1   # the package counts from 0
links$target <- match(links$to,   nodes$name) - 1
links$group  <- nodes$group[links$source + 1]        # a ribbon takes the color of the node it leaves

colors <- JS('d3.scaleOrdinal().domain(["n1","n2","n3","n4","n5","n6"]).range(["#ea1728","#89e101","#02bbe9","#f3a014","#8e44ad","#ff4f9a"])')

p <- sankeyNetwork(Links = links, Nodes = nodes, Source = "source", Target = "target", Value = "value",
                   NodeID = "name", NodeGroup = "group", LinkGroup = "group", colourScale = colors,
                   nodeWidth = 24, nodePadding = 0, fontSize = 16, sinksRight = TRUE,
                   width = 900, height = 675)
p   # opens in the RStudio Viewer or in your browser

# To keep it as a web page: htmlwidgets::saveWidget(p, "sankey.html", selfcontained = FALSE)

# This is close to the diagram on this page, not the same. R draws one color for each ribbon (so the fade between
# two colors becomes the color of the node the ribbon leaves)
# and it places the nodes by its own rule.
R draws one color for each ribbon and places the nodes by its own rule, so its diagram is close to the one on this page, not identical.
Download and use your chart
- PNG is a picture, 1,800 pixels wide, for documents and slides. With the background set to None it is see-through around the chart.
- SVG is a vector file: it stays sharp at any size and opens in programs such as Inkscape, Illustrator or PowerPoint.
- Copy image puts the chart on your clipboard, ready to paste into Word, PowerPoint or Google Slides.
- Your data stays on your computer. The diagram is drawn in your browser, and your last diagram is remembered in this browser only: press Last run in step 2 to bring it back.
Frequently asked questions
Is this Sankey diagram maker free? Do I need an account?
It is free, and there is no sign-up or login. Pick a look and start typing your flows.
What is the difference between a Sankey diagram and an alluvial diagram?
They are close relatives. A Sankey diagram shows how an amount flows between nodes, and a ribbon's width is that amount. An alluvial diagram is the same picture for categories, with a column for each variable and the same groups in every column. Give this page one row for each pair of neighbouring columns, with names such as “Yes 2020” and “Yes 2021” to keep the columns apart, and it draws that too.
How many nodes and rows can it draw?
Up to 100 names and 1,000 rows. A note under the chart says when more were left out. A diagram of ten to twenty nodes is easier to read.
What happens if my flows go round in a circle?
A Sankey diagram flows one way, so a row that would close a loop is not drawn. A note under the chart names its row, and the other rows are drawn as usual.
Why does a note say that a node's flow in is not equal to its flow out?
In a standard Sankey diagram, what flows into a node in the middle equals what flows out of it. The note names the nodes where your table says otherwise, so that you can check the numbers. The diagram is still drawn as you entered it.
Can I change the color of one node, or move one?
Yes. In step 3, Node colors has a color box for each node. Press Edit under the chart and drag a node up or down; its ribbons follow.
Can I use the diagram in Word, PowerPoint or a paper?
Yes. Download a PNG or an SVG, or press Copy image and paste it. The SVG stays sharp at any size and can be edited in a vector program.
If you like the page, please share or like it. Questions and suggestions are welcome at [email protected]. No reply? Check your spam folder.