How to make a flowchart
- Choose what to draw. In step 1 pick a flowchart, a swimlane flowchart (each step in the band of whoever does it), a concept map (ideas joined by arrows with words on them), an org chart (who reports to whom), a probability tree (the chance of each ending), a decision tree (which choice is worth most on average) or an ERD (the tables of a database and how they relate).
- Start from. In step 2 choose a table of steps, a blank canvas, or the example to see how a finished one looks.
- Or type it as a table. In step 3 write one row for each arrow: the step it starts from, the step it goes to and, if you like, its words (Yes, No). Choose top to bottom or left to right, and press Draw flowchart: the shapes are placed for you.
- Add shapes. Drag a shape from the list onto the paper, or click it to add it in the middle of what you see. A dragged shape jumps from square to square, so shapes line up by themselves.
- Join them. Point at a shape and four blue dots appear around it. Drag from a dot to another shape and an arrow joins them. Let go on the empty paper and a new box appears there, already joined.
- Type. Double-click a shape or an arrow (or click it once more when it is chosen) and type. Long text wraps to the shape's width. Enter keeps the words; Shift+Enter starts a new line.
- Style it. Choose a shape or an arrow and use the bar above the paper: fill and line colors, line width and style, round corners, the font, its size, bold or italic; for arrows, right-angle, straight or curved lines and their heads.
- Tidy and download. Move shapes and their arrows follow; resize a shape by the small squares round it, or press Auto arrange to place every shape again, top to bottom or left to right (Undo takes it back). Then download a PNG picture or an SVG file, or copy the flowchart straight into Word, PowerPoint or Google Slides.
Make a flowchart from a table
Each row of the table is one arrow. Write the step where the arrow starts under From, the step it goes to under To, and, for the answers of a question, its words under Arrow text. The same words always mean the same shape, so "Check stock" written in three rows is one box with three arrows. You can also paste the rows from Excel or Google Sheets, or open an .xlsx, .xls or .csv file.
The shape of each step comes from its words: Start and End become ovals, a question that ends with a question mark (or a step with two or more arrows out) becomes a diamond, and every other step is a box. For another shape, write its name in brackets after the step, such as Order form (document), Customers (database) or Wait for payment (delay). An arrow back to an earlier step, a loop, goes round the side.
Swimlane diagram: who does each step
A swimlane diagram, or swimlane flowchart, is a flowchart drawn in bands: one band, or lane, for each person, team or department. Each step sits in the lane of whoever does it, so you see at a glance who does what and where the work passes from one to another. Choose Swimlane flowchart in step 1, and the table in step 3 gets a fourth column, Lane: who does the step under From. A step that is only ever under To, such as End, goes in the lane of the step before it. With Left to right the lanes run across, one under another; with Top to bottom they stand side by side. In step 2 the three examples show three looks for the lanes: grey bands, tinted bands (a pale colour for each lane) and lines only (the lightest, good for printing in black and white).
On the paper, drag a step into another band to move it to that lane, and the band grows to fit it. Double-click a lane's name to rename it, press + Lane to add a lane, and to remove an empty one, click its name, then press Delete.
Org chart (organizational chart)
An org chart shows who reports to whom: each person is a card with their name and job title, and a line joins each manager to the people who report to them. Choose Org chart in step 1, then write one row for each person in step 3: the name, the job title and, under Reports to, the name of their manager. Leave Reports to empty for the person at the top. Press Draw org chart and the page places everyone: each manager in the middle above their team, and each department in its own color.
For a big team, tick Compact: people with nobody under them stand in a column below their manager, so the chart stays narrow enough for a page or a slide. On the paper, drag a card's blue dot onto an empty spot to add a new person, already joined, and press Auto arrange to tidy the chart again. A staff list from Excel (name, job title, manager) can be pasted straight into the table.
Probability tree
A probability tree shows the chances of what can happen, one step after another: each branch carries its probability, and the probability of an ending is found by multiplying the probabilities along its path. Choose Probability tree in step 1 and write one row for each branch in step 3: its Level (1 for the first branches, 2 for the branches that follow them, 3 for the next ones), the event and its Probability, which can be written as 0.3, 30% or 3/10. A row belongs under the nearest row above it with a smaller Level, so the same words, such as "Late", can be used under different events.
Press Draw probability tree and the page draws it from left to right, works out every ending (rain, then late: 0.3 × 0.2 = 0.06) and checks that the endings add up to 1. If the branches after an event do not add up to 1, a note under the picture says so. Leave the last probability of a group empty and the page fills in what is left over. To change a number, change the table and draw again: your colors and sizes stay.
Decision tree (expected value)
A decision tree helps you choose between options when the outcome is uncertain. A square is a choice you make, a circle is something that happens by chance, and a triangle is where a branch ends. Choose Decision tree in step 1 and write one row for each branch in step 3: its Level, the choice or the outcome, its Probability (only for something that happens by chance) and its Value, a payoff or a cost with a minus sign.
Press Draw decision tree and the page adds the values along each path, takes the average of the outcomes at every circle (the expected value, EV) and the best option at every square. The best path is drawn in green, and the option you do not take is grey and dashed, with a double stroke across it. For example: launching a product costs 20 and brings 200 with probability 0.6 or loses 50 with probability 0.4, so launching is worth 0.6 × 180 + 0.4 × (−70) = 80, while not launching is worth 0.
ERD (entity relationship diagram)
An entity relationship diagram, or ERD, shows the tables of a database and how they relate. Each table (an entity) is a box with its name on a band and one attribute on each line, with PK (primary key), FK (foreign key) or UK (unique) in a column of its own. A line joins two tables, and the mark at each end says how many rows of that table can be on that side, in crow's foot notation: two bars for exactly one (mandatory one), a circle and a bar for zero or one (optional one), a bar and a three-pronged foot for one or many (mandatory many), and a circle and the foot for zero or many (optional many). A bar on its own means one and the foot on its own means many, with nothing said about whether the other side is required.
Choose ERD in step 1 and write one row for each attribute in step 3: the Entity, the Attribute and, for a key, PK, FK or UK in Key. An entity written in several rows is one table. To join two tables, write the other one in Related entity. On an attribute row (a foreign key, such as customer_id in Order) the line is many to one; on a row with no attribute it is one to many. In Relationship write the ratio and, if you like, the words on the line: 1:N contains, N:1 places, N:N or 1:1. The ratio reads from the table in the row to the related entity, so put 1:N on the row of the "one" table. A plain 1 draws a bar and a plain N draws the foot; for the full marks write exactly one, zero or many, mandatory or optional (mandatory one to optional many, 0..1 to 1..*, or Mermaid's ||--o{). With nothing in Relationship, the line shows exactly one at the one end and zero or many at the other. Press Draw ERD and the page places the tables, the "one" side above the "many" side.
On the paper, click a table and then its words to type: the first line is the name, every other line is an attribute, and the table grows with its lines. Drag a table's blue dot onto another table to join them; choose the line and set what it shows at each end in the bar above the paper (Line start and Line end). A table with many columns can be pasted straight from a spreadsheet into the table in step 3.
Concept map
A concept map shows ideas and how they are joined: each arrow carries the words that link two ideas, such as "includes" or "uses". Choose Concept map in step 1 and write one link on each row: an idea under From, the idea it leads to under To and the joining words under Arrow text. Every idea becomes a rounded box, the arrows are straight, and the ideas are placed symmetrically.
How the shapes are placed (Layout). Choose Straight path to keep the main route (the Yes answer, or the first arrow) in one straight line, with the other answers at the side; it suits a process with several questions. Choose Symmetric to put every question in the middle of its answers, Yes up or left and No down or right, and the step where the answers meet again in the middle of them; it suits equal alternatives that join again. Tick Compact to pack the shapes closer for a smaller picture. The same three choices sit above the paper, next to Auto arrange, and place the drawing again when you change them.
Colors (Style). Each kind of shape has its own color: start and end ovals are green, steps blue, questions amber, and so on. Under Style, above the paper, pick another set: Bright, Earth, Ocean, Sunset, Midnight, Blueprint (pale blue with blue lines) or Plain (white). A color you give a shape yourself stays when you change the style, and it goes into the PNG and SVG downloads like everything else. In the bar above the paper, next to Fill, the list after All gives every shape a gradient instead of one solid color: Top to bottom (lighter at the top), Diagonal (lighter in the top-left corner) or Soft glow (lighter in the middle). Each gradient is made from the shape's own color, so the style, or a color you chose, still decides the hue.
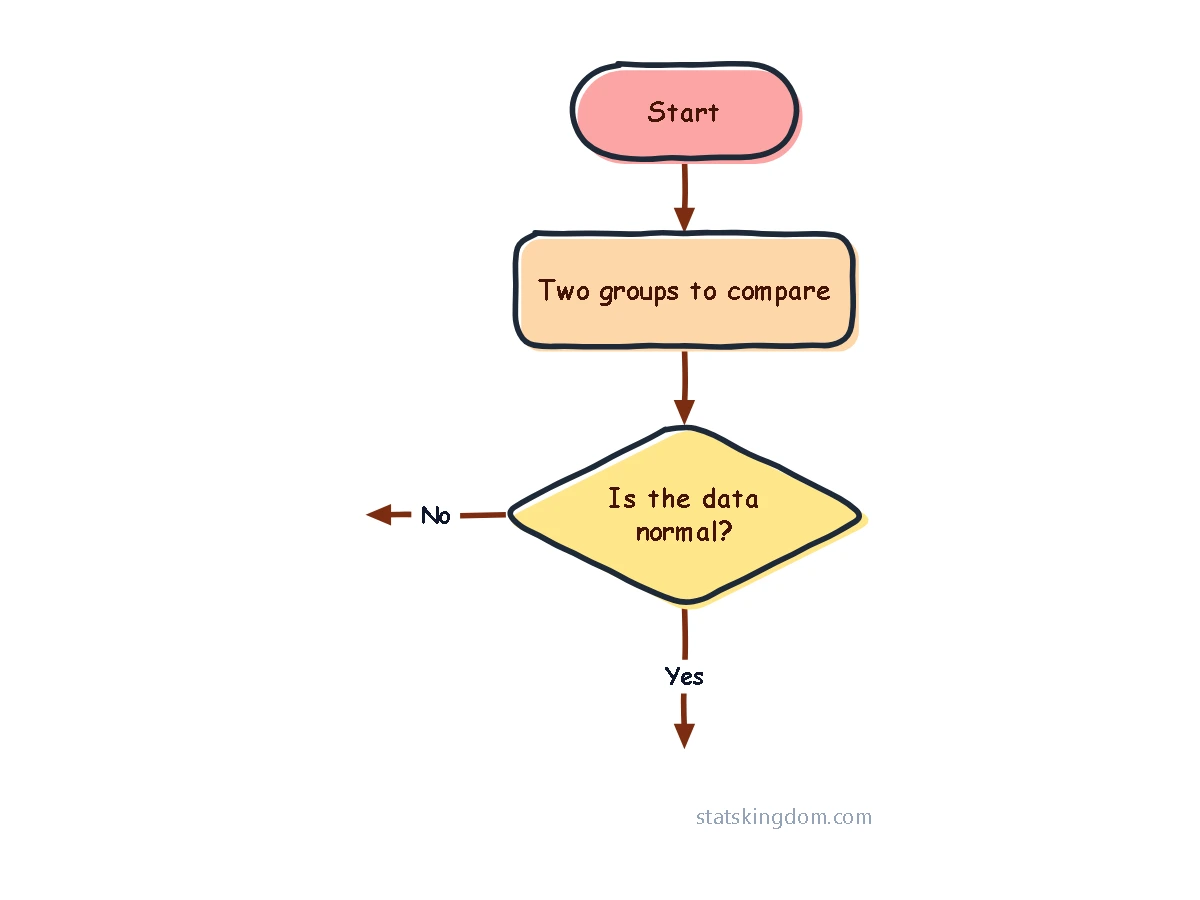
How the shapes are drawn (Shapes). Under Shapes, next to Style, choose Classic (the standard flowchart shapes), Rounded (every corner softened), Bubbly (very round shapes with a soft shine and shadow), Sketch (shapes and arrows drawn by hand, a little wobbly) or Cartoon (thick hand-inked outlines with the color printed a little off the line, thick arrows and bold, friendly words). The choice changes every shape together, so the drawing looks like one set. Your colors and layout stay, and so does a Step's own Corners value; a line width, line color or font you gave a shape yourself also stays when you pick Cartoon. It goes into the PNG and SVG downloads too.
After you edit the drawing you can still change the table and draw again: the shapes are placed again, and each step keeps the shape, colors and size you gave it. Undo brings the old drawing back.
Arrows, the pen and the picture
- Arrows: right-angle, straight or curved; an arrowhead at the end, at both ends, at the start or none (a plain line), shaped as an arrow, an open arrow, a dot or a diamond; any color, width, dashed or dotted.
- Join anywhere: drop an arrow on a blue dot for the middle of a side, or anywhere along a straight side. To move an arrow's end to another shape, click the arrow and drag one of the round handles at its ends.
- Move the middle line: a right-angle arrow usually has three pieces. Press on the middle one and drag it: the piece before it gets shorter and the piece after it longer, or the other way round. It jumps from square to square (hold Alt to move it freely) and, with the arrow chosen, the arrow keys move it too. The button with the circular arrow in the bar above the paper puts it back where the program places it.
- Your own shape: press Pen and draw on the paper. Join the ends for a closed shape; it can be filled, resized, typed in and joined like any other.
- The picture: add a title, choose a white, light grey or see-through background, keep the squares in the picture if you like them, and type your own name as the watermark or clear it.
Flowchart shapes and what they mean
- Start / End (an oval): where the process begins and where it stops.
- Step (a box): one action, such as "Collect the data".
- Decision (a diamond): a question with two or more answers. Each answer leaves on its own arrow, for example Yes and No.
- Input / Output (a slanted box): data that comes in or goes out.
- Document (a box with a wavy bottom): a document or a report.
- Sub-process (a box with double sides): a process drawn in a flowchart of its own.
- Database (a cylinder): data that is stored.
- Manual input (a box with a slanted top): data typed in by hand.
- Preparation (a hexagon): setting up before a step, such as the start of a loop.
- Delay (a half-round box): waiting before the next step.
- Connector (a small circle): joins two parts of a big flowchart on the same page.
- Off-page link (a pointed box): the flowchart goes on on another page.
- Note (a box with a folded corner) and Text: words for the reader.
Moving around the paper
- Choose several shapes: drag a box round them on the empty paper, or Shift+click each one. They move together.
- Keys (when the paper has been clicked): the arrow keys move the chosen shapes one small square (with Shift, one big square); Delete deletes; Enter types; Esc lets go; Ctrl+Z and Ctrl+Y undo and redo; Ctrl+C, Ctrl+V and Ctrl+D copy, paste and make a copy; Ctrl+A chooses everything.
- More room: drag a shape past the edge of the paper and the paper grows and scrolls with you. Zoom with the − and + buttons, or Ctrl + mouse wheel; Fit shows the whole flowchart.
- On a phone: a finger on a shape drags it, a finger on the empty paper scrolls, and two taps on a shape let you type in it.
Download and use your flowchart
- PNG is a picture, saved at twice the size you see so it stays sharp. With the background set to See-through it has no background at all.
- SVG is a vector file: it stays crisp at any size and opens in programs such as Inkscape, Illustrator or PowerPoint, where it looks the same as here.
- Copy image puts the flowchart on your clipboard, ready to paste.
Only the flowchart is in the picture, with a small margin round it: the blue boxes and the dots are not, and the squares of the paper only when you ask for them.
Frequently asked questions
Is the flowchart maker free?
Yes. There is nothing to install and no sign-up, and the pictures you download are yours to use.
Is my flowchart saved?
Each change is saved in this browser only, on this computer. Next time, step 2 shows "Your last flowchart" to bring it back. Nothing is sent anywhere.
Can I make a flowchart from Excel?
Yes. Put one arrow on each row, with the step it starts from in the first column, the step it goes to in the second and its words in the third. Copy the cells and paste them into the table in step 3, or open the file there, then press Draw flowchart.
What is a swimlane diagram?
A flowchart split into bands (lanes), one for each person, team or department that takes part in the process. Each step sits in the lane of whoever does it, so every hand-over shows as an arrow that crosses from one lane to another. Choose Swimlane flowchart in step 1 to make one, from a table or on a blank canvas.
How do I draw a probability tree with the probabilities worked out?
Choose Probability tree in step 1. Write one row for each branch: its Level (1 for the first branches, 2 for the ones after them), the event and its probability. Press Draw probability tree: the page multiplies the probabilities along each path and shows the probability of every ending, and checks that they add up to 1.
How do I work out the expected value in a decision tree?
Choose Decision tree in step 1 and write one row for each branch with its Level, name, probability (for chances only) and value. The page adds the values along each path, averages the outcomes at every chance (circle), takes the best option at every choice (square) and marks the best path in green.
How do I make an org chart from an Excel list?
Choose Org chart in step 1. Put one person on each row, with the name in the first column, the job title in the second and the manager's name in the third (empty for the person at the top). Copy the cells and paste them into the table in step 3, or open the file there, then press Draw org chart.
How do I draw an ERD from a list of columns?
Choose ERD in step 1. Put one column of your database on each row: the table name in the first column, the column name in the second and PK, FK or UK in the third if it is a key. For a foreign key, write the table it points to in Related entity. Copy the cells and paste them into the table in step 3, or open the file there, then press Draw ERD.
In Relationship you can say how the two tables relate: the mark for the table in the row first, then the mark for the related entity. Examples; in each picture the left end is the table in the row and the right end the related entity:
- zero or one to many
- Exactly one to many
- Exactly one to zero or many
- 1:N
- 1:N Contain
- N:N
- 0..1 to 1..N
- 0..1:1..N
Can I use my flowchart in Word or PowerPoint?
Yes. Click Copy image and paste it, or download the PNG. The SVG file can also be opened in PowerPoint, where it stays sharp when you make it bigger.
If you like the page, please share or like it. Questions and suggestions are welcome at [email protected]. No reply? Check your spam folder.