Information
Guide
- Bonferroni correction
- Central Limit Theorem
- Confidence interval
- Linear regression
- Logistic regression
- Outliers
- P-value
- Skewness and kurtosis
- Standard deviation
- Test power
- Venn diagram example
Statistical Tests
- Chi-squared test
- Kruskal-Wallis Test
- Levene's test
- Mann-Whitney U Rank test
- One Way ANOVA test
- Proportion test
- Shapiro Wilk test
- T-test
- T-test vs Z-Test
- Tukey HSD test
- Wilcoxon Sign Rank test
Variables
Categorical
Nominal - two or more categories with no order. Example, green, blue, red.Dichotomous - nominal variable with two categories. Example, true, false.
Ordinal - the categories can be ordered. Example, Likert scale - Strongly disagree, Disagree, Neither agree nor disagree, Agree, Strongly agree.
Continuous
An Infinite possible numeric values in any range.Scale
The following definitions may be relevant to ordinal variables or for the continuous variables.Interval - There is a meaning for the distances between the values but not for the ratio between the values. For example, in degrees Celsius, increasing the temperature from 40°C to 60°C is double the increase from 40°C to 50°C, but 60°C is not twice as hot as 30°C.
Ratio -There is a meaning for the distances between the values and also for the ratio between the values. For example, a duration of 60 minutes is twice as long as a duration of 30 minutes.
Measures
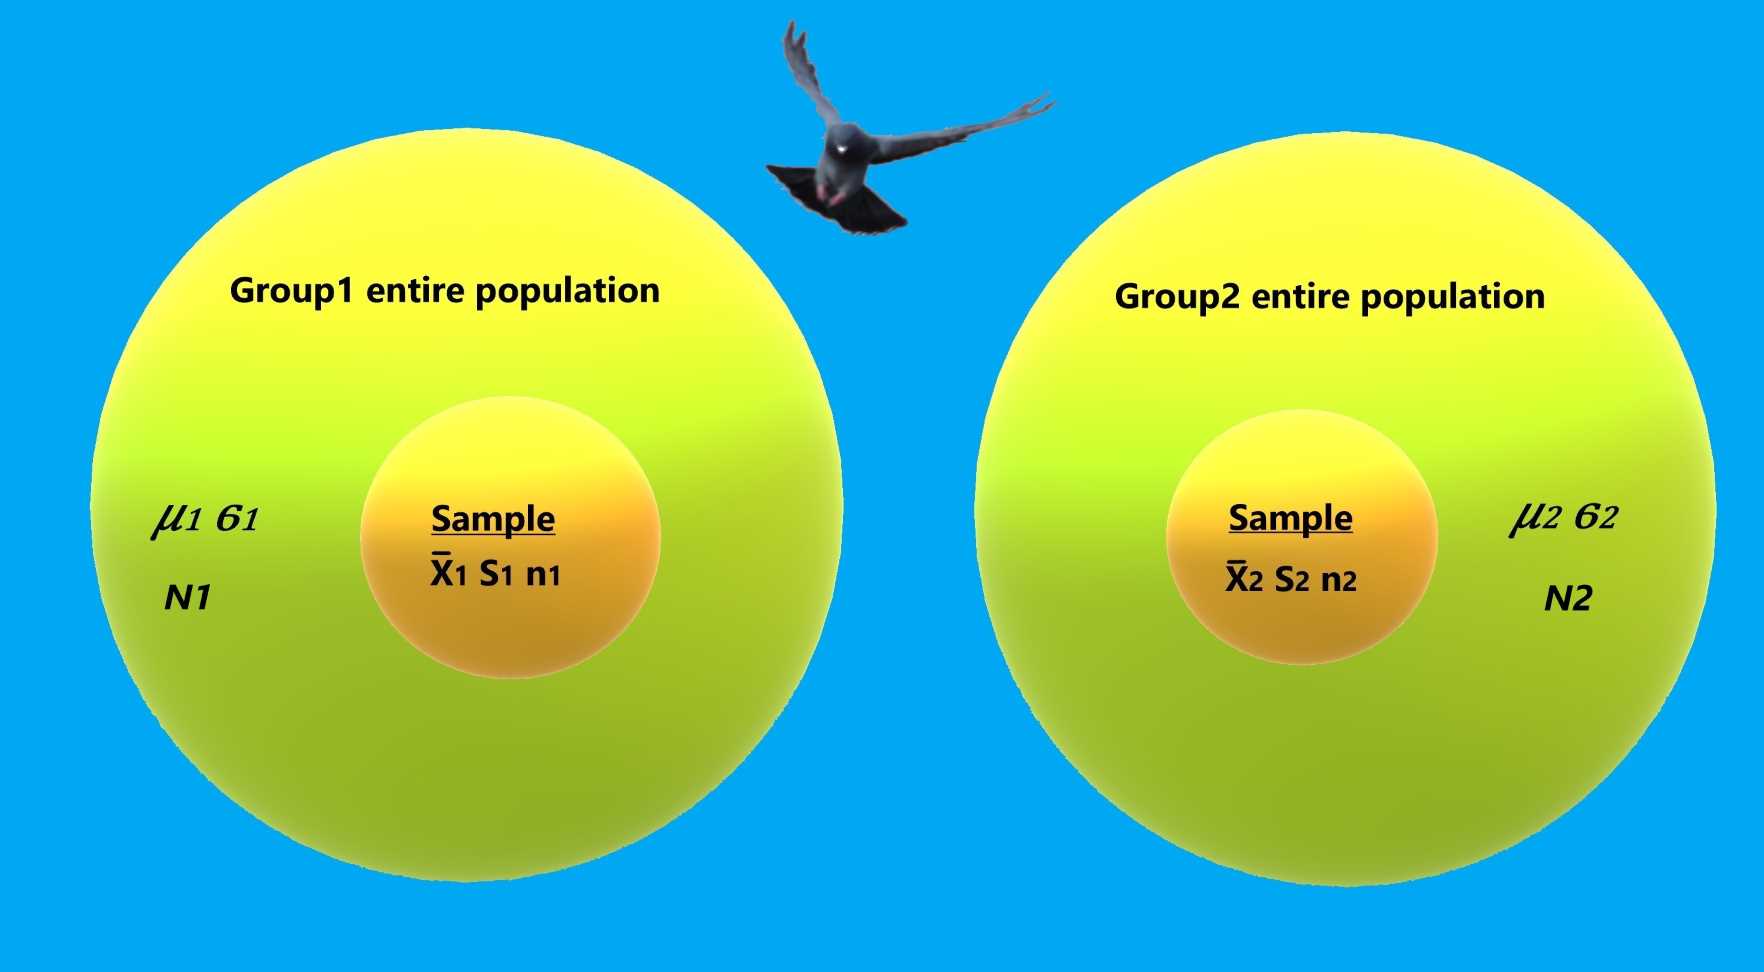
The only way to describe the data fully is to supply the entire data which is not very practical. Instead we can supply several measures that will support a good description of the data. Usually we don't have the entire data, so we collect a random sample data that should represent the entire set.
Population parameters
The population parameters are absolute values that are usually unknown to the sampler. These are the measurements that random samplings hope to approximate.
| Name | Description | Formula |
|---|---|---|
| N | The size of the entire population. | |
| Mean(μ) | The average of the population, or the sum of all of the different values in the sample divided by the number of values. |  |
| Standard deviation(σ) | This is a standard measure of the spread of the data. It is derived from the square root of the distances between each value in the population and the population mean squared. |  |
| Variance | Represent the amount of variation of the data. Also known as, the standard deviation squared. |  |
Sample statistics
In most cases we are unable to collect the measures of the entire population. Instead, we take samples and calculate statistics based on these samples.
Each sample statistic is a random variable which attempts to estimate one of the population's parameters.
| Name | Description | Formula |
|---|---|---|
| n | The size of the sample. | |
| x | This is the average of the sample and is an approximation for the population's mean (μ). This estimation for the population parameter has better accuracy the larger the samples size, n, gets. |  |
| S | Sample Standard Deviation, is the estimation for the Standard Deviation (σ). the bigger the sample size n, the better the estimation. unlike population standard deviation the calculation uses n-1, instead of n. when using n-1 the estimation will not be biased, say the average of the estimation will be the standard deviation |  |
| S2 | The spread of the values in the specific sample. |  |