Standard deviation
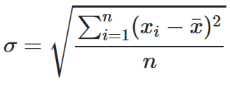
The standard deviation is a statistic that measures the data variability. It is derived from the square root of the distances between each value in the population and the population's mean squared.
Standard deviation formula
Variance formula
| Variance = σ2 = | Σ(𝑥i-x̄)2 |
| n |
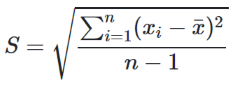
Sample standard deviation formula
Sample variance formula
| Sample variance = S2 = | Σ(𝑥i-x̄)2 |
| n-1 |
We use n-1 instead of n, to correct the biased estimation of the variance (partially correct the estimation of the standard deviation) (Bessel's correction).
If you ask a school kid how to measure the variability, he will probably suggest one of the following:
1. Range: Maximum minus minimum: Max(𝑥i)-Min(𝑥i).
2. MAD (Mean Absolute Deviation): The average of the absolute differences.
| MAD = | Σi|𝑥i-x̄| |
| n |
Why does the standard deviation formula use squares differences instead of absolute differences?
In other words, why do we use the standard deviation instead of the MAD?
1. In Mathematics it is more elegant to use second power and square root functions than to use the absolute function, hence easier calculation. (squares is continuously differentiable, easy to derive for a minimum or maximum, while absolute is not).
2. Absolute differences grant equal weight to any difference while square differences grant larger weight to a big difference. This may be good when the outlier is correct, a higher weight emphasizes that the data may spread more, but it may be worse when the outlier is incorrect, See example, and the large weight of the incorrect observation influences more the result.
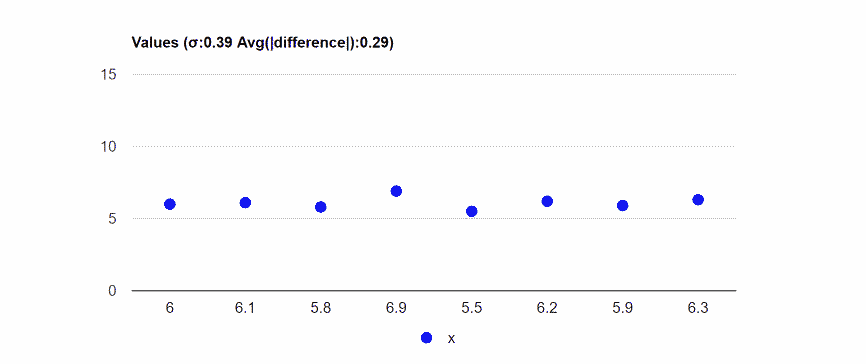
Example - Low and High Standard deviation
In the following example, 'high' and 'low' are only relative.
MAD - Mean Absolute Deviation, the average of the absolute distances from the average.
Data: 6,6.1,5.8,6.9,5.5,6.2,5.9,6.3.
Average absolute distance from the average: 0.29.
Standard deviation: 0.39
Data: 7,1,6,2,11,3,4,5,2,3,4,5,9,7,5,5,8.
Average absolute distance from the average: 2.03.
Standard deviation: 2.59.

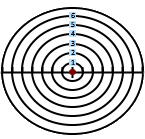
Dartboard example
Following a visual example of the standard deviation calculation.
The red circle in the middle symbolizes the average.
The radius represents the absolute difference from the average.
Values: 4, 1, 9, 10
| Average = | 4 + 1 + 9 + 10 | =6 |
| 4 |
Press the "run" button to run the demonstration!
Difference (r): 2
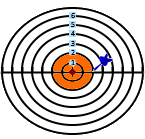
Difference (r): 5
Difference (r): 3
Difference (r): 4
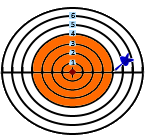
Standard deviation (r): 3.67
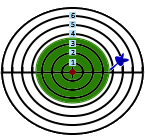
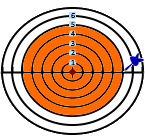
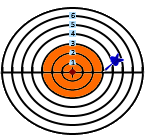
Green circle: has the average area of all the orange circles.
| Green circle area= | π*22+π*52+π*32+π*42 | =π*3.672 |
| 4 |
The π doesn't influence the result, it is only for the visualization. If we would use the square shape instead of the cycle we would get the same result.
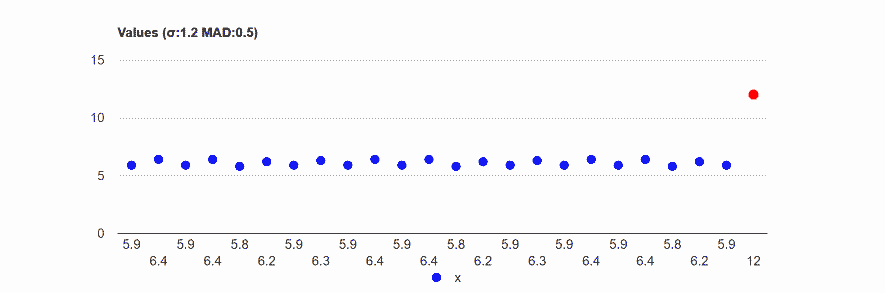
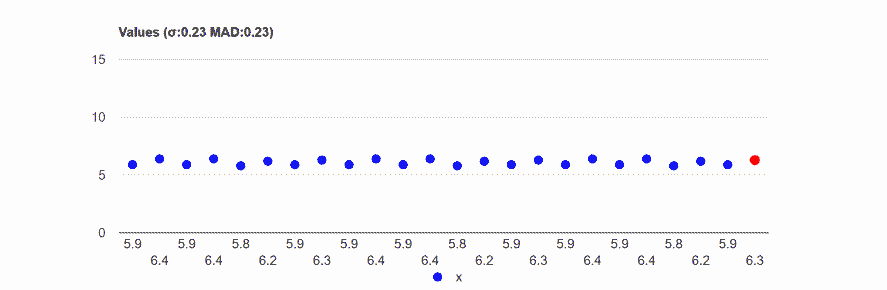
Outlier effect - example
In the following example, we took a special case when the standard deviation and the mean absolute deviation are similar.
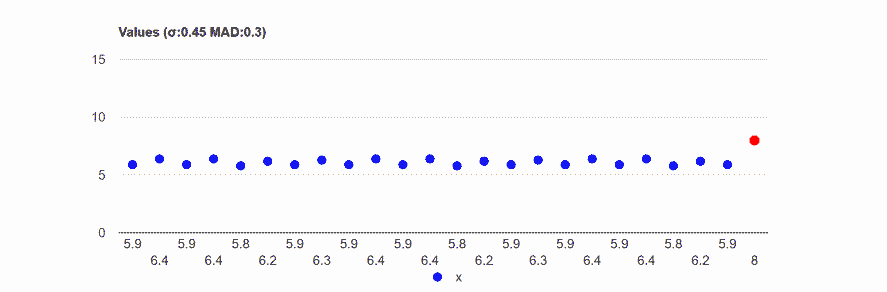
Even one outlier in a group of 24 influence dramatically both measurements, the MAD and the standard deviation, but it affected much more the standard deviation.
Data: 5.9,6.4,5.9,6.4,5.8,6.2,5.9,6.3,5.9,6.4,5.9,6.4, 5.8,6.2,5.9,6.3,5.9,6.4,5.9,6.4,5.8,6.2,5.9,6.3
MAD: 0.23.
Standard deviation (σ): 0.23
Data: 5.9,6.4,5.9,6.4,5.8,6.2,5.9,6.3,5.9,6.4,5.9,6.4, 5.8,6.2,5.9,6.3,5.9,6.4,5.9,6.4,5.8,6.2,5.9,8
MAD: 0.3 (+30%).
Standard deviation (σ):0.45 (+96%).
Data: 5.9,6.4,5.9,6.4,5.8,6.2,5.9,6.3,5.9,6.4,5.9,6.4, 5.8,6.2,5.9,6.3,5.9,6.4,5.9,6.4,5.8,6.2,5.9,12
MAD: 0.5 (+117%).
Standard deviation (σ): 1.2 (+420%).