Distribution shape
The standard deviation calculator calculates also the skewness and kurtosis. The calculator generate the R code.Skewness
The symmetrical level of the probability distribution (or asymmetrical level).
There are many ways to calculate the skewness. The website uses the adjusted Fisher-Pearson standardized moment coefficient:
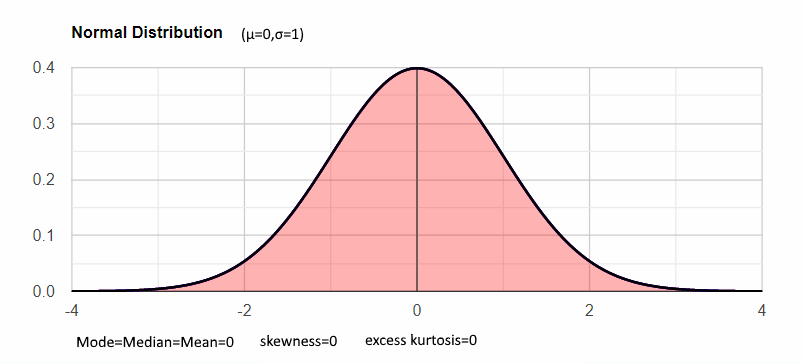
Symmetrical distribution
For a perfect symmetrical distribution the skewness is zero. In real data the skewness level will be around the zero. With a smaller sample size the absolute skewness number may be higher for a symmetrical distribution.
In a symmetrical distribution Mean = Median = Mode
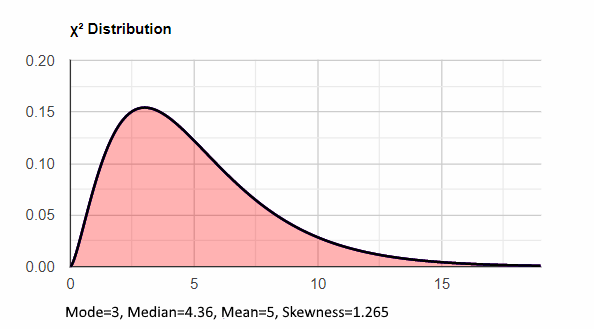
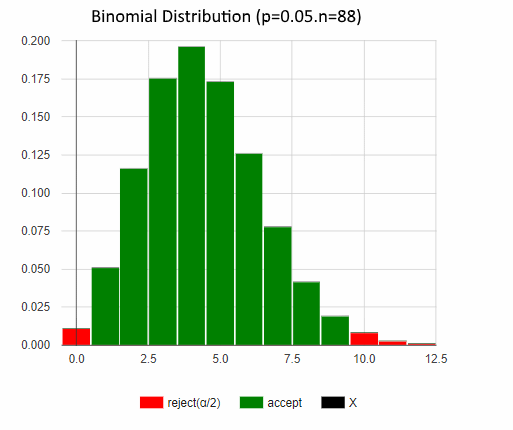
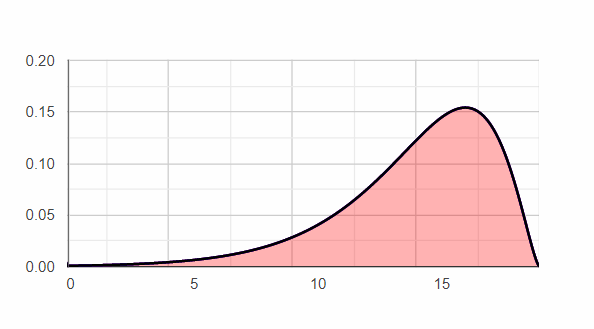
Positive skewness (right)
A positive skewness represent asymmetrical distribution with long right tail, like chi-squred distribution, binomial distribution.
In a positive distribution Mean ≥ Median ≥ Mode
Negative skewness (left)
A negative skewness represent asymmetrical distribution with long left tail.
In a negative distribution Mean ≤ Median ≤ Mode
Kurtosis
The Kurtosis measured the level of the tails. $$population\;kurtosis=n\frac{\sum_{i=1}^{n}(x_i-\bar{x})^4}{(\sum_{i=1}^{n}(x_i-\bar{x})^2)^2}= \frac{\sum_{i=1}^{n}(x_i-\bar{x})^4}{n\sigma^2}$$ Since the "stronger" part in the formula is:
$$(x_i-\bar{x})^4$$ Values that are far from the average will mostly determine the Kurtosis value, independently of the value sign. For example if the average is 10, two values of 10 and 100 will increase the kurtosis more than two values of 80: $$(100-10)^4>2(80-10)^4$$ ~65M>~48M But 2 values of 90 will increase the kurtosis more than [10,100], ~82M>65M. So it is mainly the distance from the average but also the amount if values far from the average.Excess Kurtosis
The kurtosis value of the normal distribution is 3. most statistical software shift the measurement to be 0 for the normal distribution. This website uses the following sample excess kurtosis formula to calculate the kurtosis. $$sample\;excess\; kurtosis=\frac{n(n+1)(n-1)*\sum_{i=1}^{n}(x_i-\bar{x})^4}{(n-2)(n-3)*\sum_{i=1}^{n}(x_i-\bar{x})^2}-\frac{3(n-1)^2}{(n-2)(n-3)}$$Mesokurtic - normal tail
When the excess kurtosis is around 0, or the kurtosis equals is around 3, the tails' kurtosis level is similar to the normal distribution.
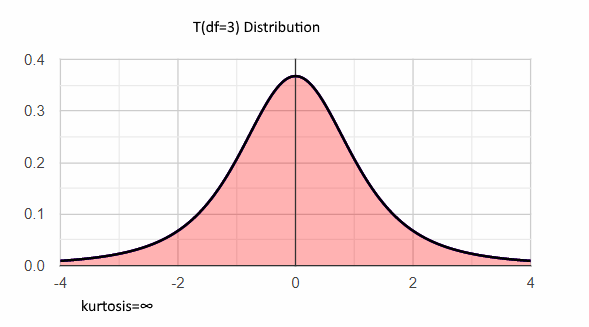
Leptokurtic - positive excess kurtosis, long heavy tails
When excess kurtosis is positive, the balance is shifted toward the tails, so usually the peak will be low, but a high peak with some values far from the average may also have a positive kurtosis!
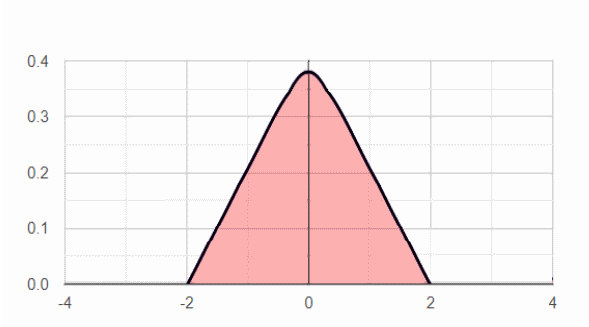
Platykurtic - negative excess kurtosis, short thin tails
When excess kurtosis positive, the balance is shifted out of the tails, so usually the peak will be high, but a low-medium peak with no values far from the average may also have negative kurtosis!