Shapiro Wilk Test
The Shapiro Wilk test checks if the normal distribution model fits the observations. It is usually the most powerful test for the normality.
The test uses only the right-tailed test. When performing the test, the W statistic is only positive and represents the difference between the estimated model and the observations. The bigger the statistic, the more likely the model is not correct. The left-tailed may represent a value that is too small, the W statistic can't be too small.
Calculation
Shapiro Wilk test with tables
When the sample size between 3 and 50:
- Sort the data when x(1) is the smallest and x(n) is the largest.
- $$W=\frac{(\sum_{i=1}^{n}a_ix_{(i)})^2}{\sum_{i=1}^{n}(x_i-\bar{x})^2}$$ Use the coefficients ai from the relevant tables.
- Calculate the p-value from the SW tables.
Since you use tables the W will be between two values: W1 and W2, and the p-value between the relevant two p-values: P1 and P2.
Calculate the approximate p-value using a linear ratio: $$p\text{-value}=p_1+\frac{(W-W_1)}{W_2-W_1}\times(P_2-P_1)$$
Shapiro Wilk test power
Compare to other tests the Shapiro Wilk test has a good power to reject the normality, but like any other test, it needs to have a sufficient sample size.
Like any other test, the Shapiro Wilk Test power depends on the effect size the test is expected to identify. When the distribution is similar to the normal distribution, the effect size is small and large sample size is required.
When the distribution is different than the normal distribution, the effect size is large and small sample size is required.
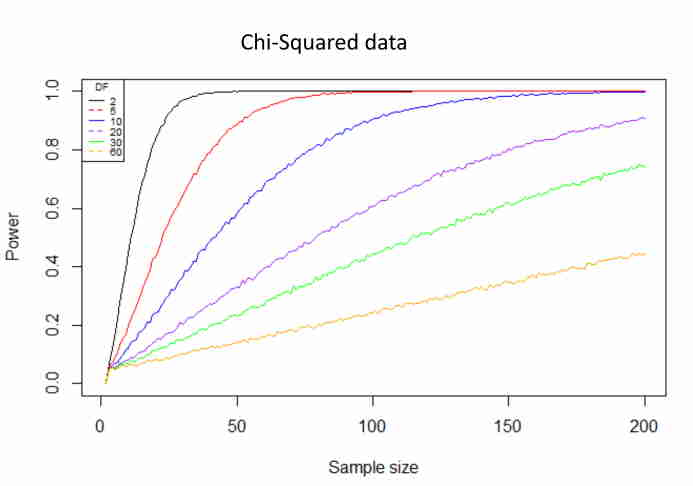
The following chart shows the power of the Shapiro-Wilk test to reject the normality assumption for the chi-square distribution data.
When the distribution is similar to the normal distribution the effect size that the Shapiro Wilk test needs to recognize is small.
When the distribution is different than the normal distribution the effect size that the Shapiro Wilk test needs to recognize is large.
In the following examples, there is some focus on the distribution symmetry, but this is only one parameter.
Shapiro Wilk power - Chi-Squared distribution
The following chart was created with R simulation. Degree of freedom: 2, 5, 10, 20, 30, 60.
Sample size (n): 2–200.
Significance level (α): 0.05.
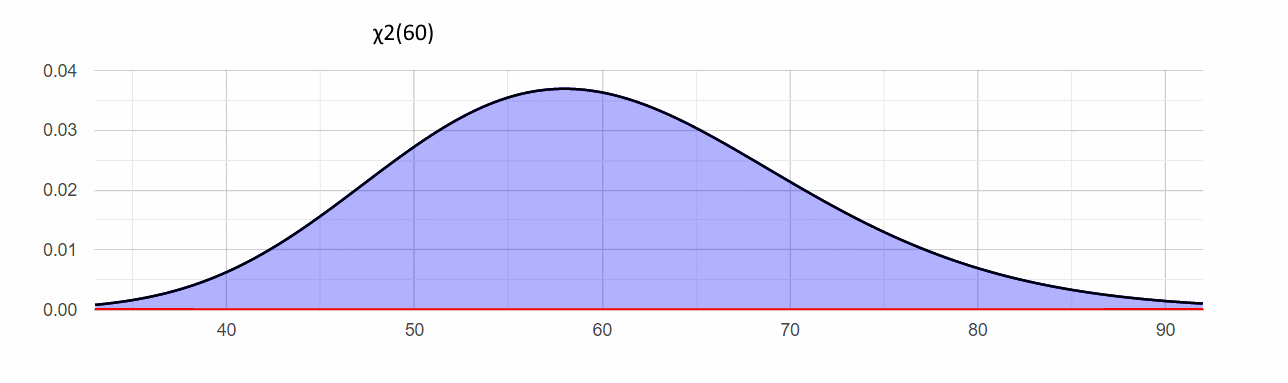
χ2(60) distribution
The χ2(60) distribution is quite symmetrical, skewness = 0.3651 (√(8/60)), very close to zero. The effect size the Shapiro Wilk test needs to recognize is small, hence you need to have a large sample size of 440 (out of the chart scale) to gain the power of 0.8. In this case, the chance to reject the normality assumption is 80%.
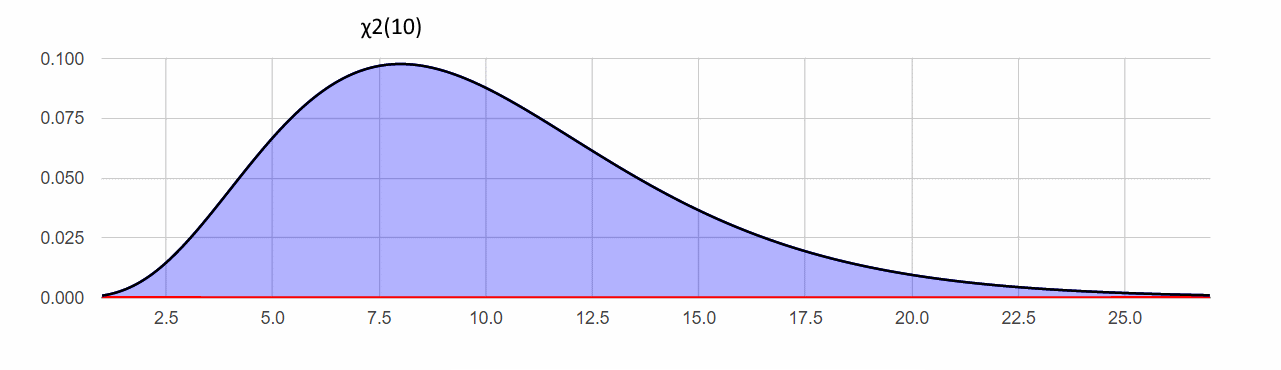
χ2(10) distribution
The χ2(10) distribution is less symmetrical, skewness = 0.8944 (√(8/10)), so you need to have a smaller sample size of 77 to gain the power of 0.8.
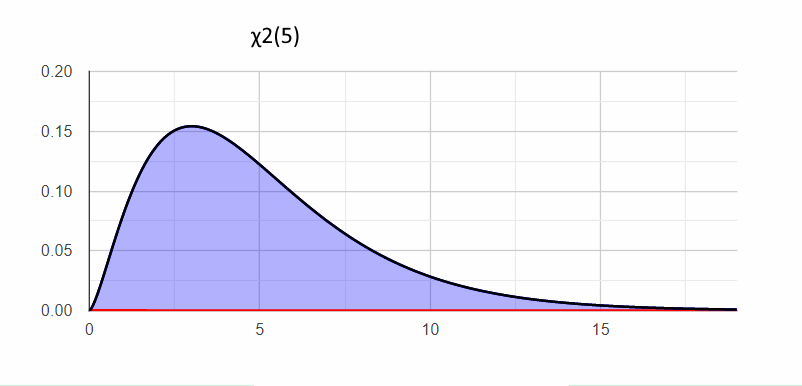
χ2(5) distribution
The χ2(5) distribution is less symmetrical, skewness = 1.2649 (√(8/5)), so you need to have a smaller sample size of 41 to gain the power of 0.8.
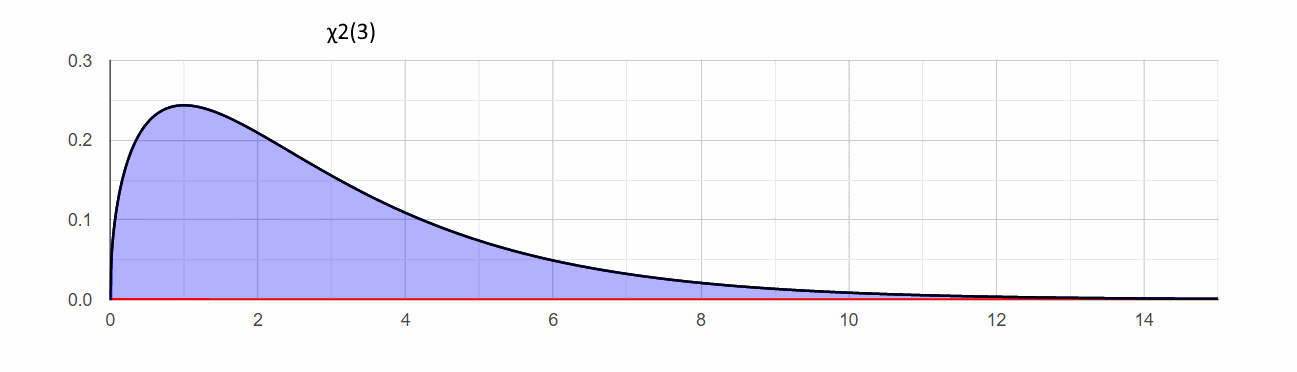
χ2(3) distribution
The χ2(3) distribution is not symmetrical, skewness = 1.6329 (√(8/3)), so you need to have a smaller sample size of 26 to gain the power of 0.8. In this case, the chance to reject the normality assumption is 80%.
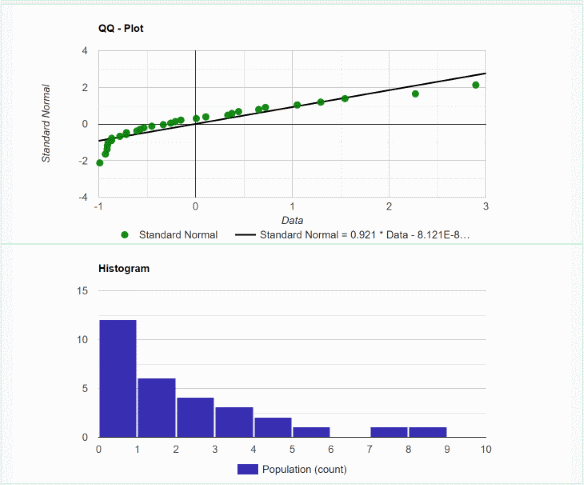
Chi-Squared (n=30, df=2)
P-value = 0.0007
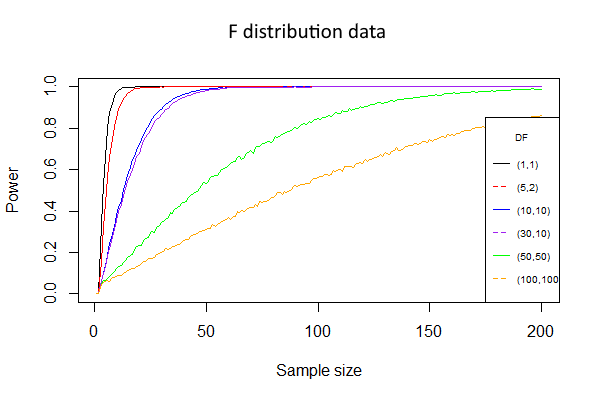
Shapiro Wilk power - F (Fisher) distribution
The following chart was created with R simulation. Degree of freedom: (1,1), (5,2), (10,10), (30,10), (50,50), (100,100).
Sample size (n): 2–200.
Significance level (α): 0.05.
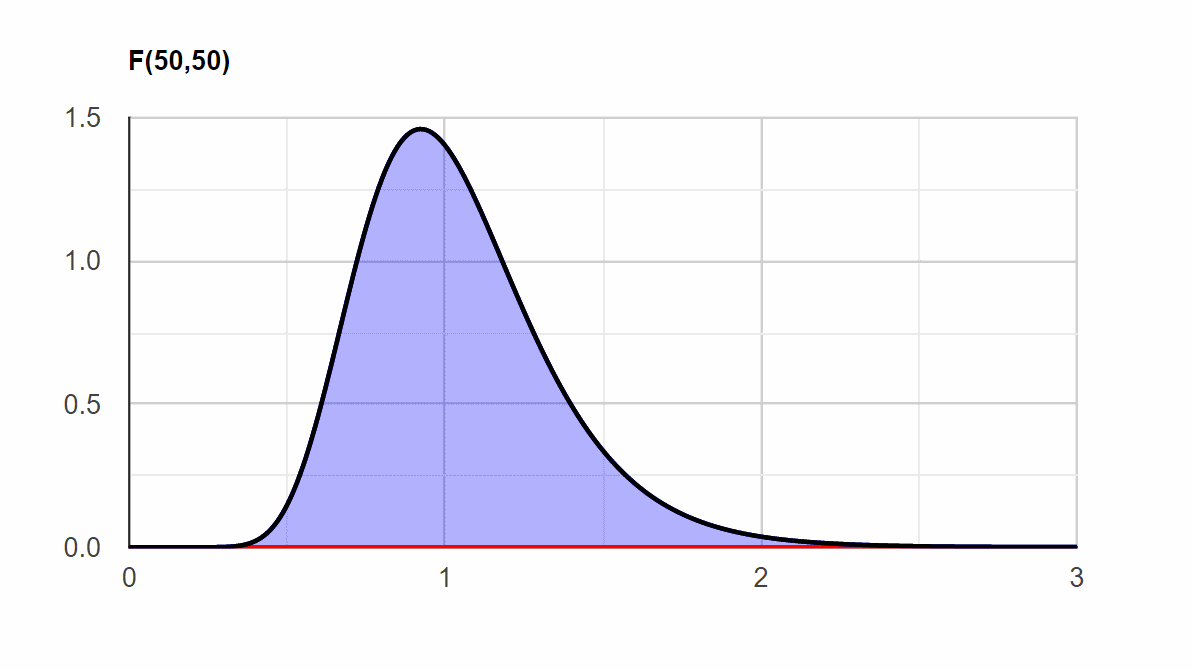
F(50,50) distribution
The F(50,50) distribution is moderate skewed, skewness = 0.9217 (√(8/3)), looks very similar to the normal distribution. Hence only a large sample size of 90 is needed to gain the power of 0.8. In this case, the chance to reject the normality assumption is 80%.
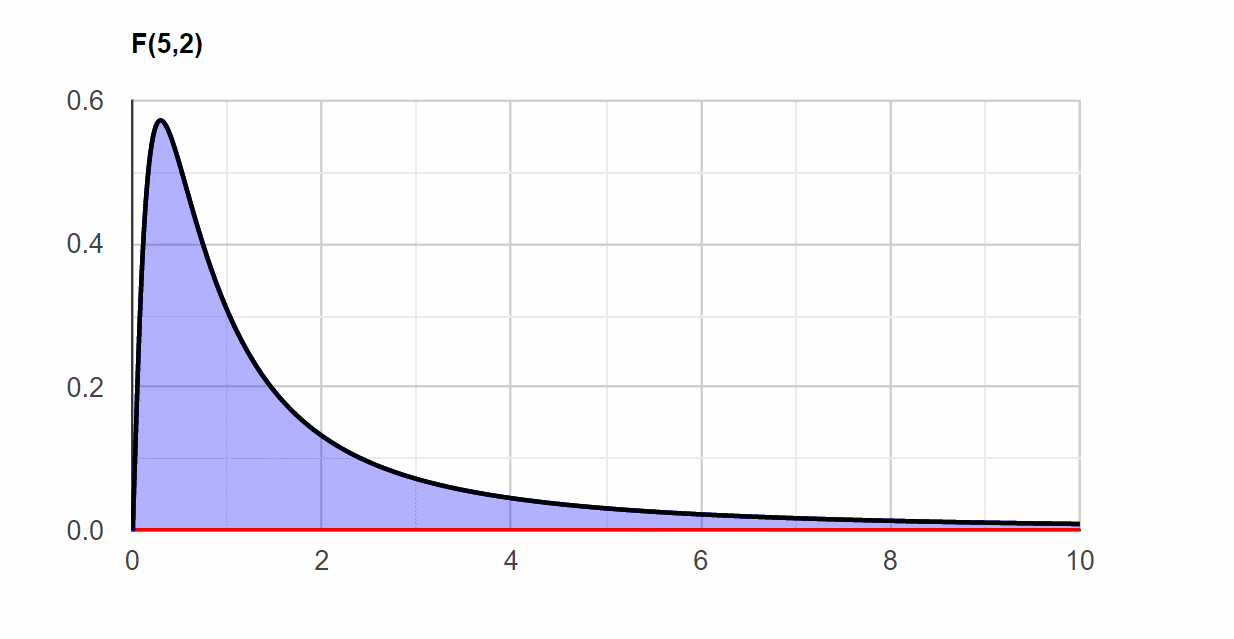
F(5,2) distribution
The F(5,2) distribution is not symmetrical, skewness = 1.6329 (√(8/3)), doesn't look like a normal distribution.
So you need to have a small sample size of 9 to gain the power of 0.8.
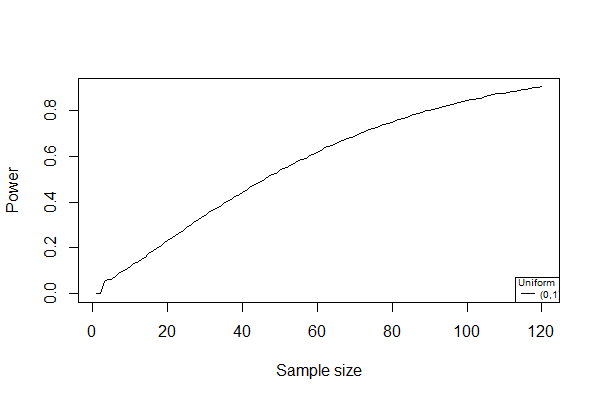
Shapiro Wilk power - uniform distribution
The following chart was created with R simulation. The uniform distribution is symmetrical but doesn't look like the normal distribution.
Uniform[0,1] (n=30)
P-value = 0.078
![SW Uniform [0,1] n=30](images/sw_uniform_30.png)