Confidence Interval
What is a confidence interval?
When using the sample data we know the sampled statistic but we don't know the true value of the population's measures.
Instead, we may treat the population's measure as a random variable.
The confidence interval is the range that is likely to contain the true value with a probability of the confidence level. The range includes the hedges, this is relevant for discrete statistics.
For example, if you chose a 0.95 confidence level, if you would calculate the confidence interval over an infinite number of samples, 95% of the calculated confidence intervals will contain the true value.
Confidence Interval = Estimate value ± MOE
MOE - Margin of Error
CL -confidence level
α = 1 - CL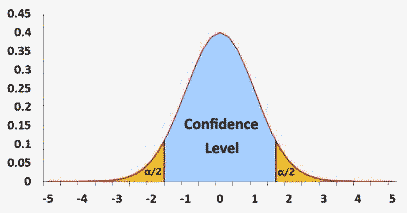
Mean confidence interval (go to calculator)
The mean's confidence interval is based on the sample average.When you know the population's standard deviation (σ) you should use the normal distribution.
$$\bar{x}\pm Z_{1-\frac{\alpha}{2}}\frac{\sigma}{\sqrt{n}}$$ You may calculate the sample size based on the required MOE
$$n=(\frac{Z_{1-\frac{\alpha}{2}}*\sigma}{MOE})^2$$ When you don't know the population's standard deviation you should use the sample standard deviation (S) and the t distribution.
$$\bar{x}\pm T_{(1-\frac{\alpha}{2},n-1)}\frac{S}{\sqrt{n}}$$
Standard deviation confidence interval (go to calculator)
The population's confidence interval is based on the sample standard deviation.The following statistic distribute Χ2(n-1) $$\frac{(n-1)S^2}{\sigma^2} \sim \chi^2_{(n-1)}$$ You may extract the σ based on Χ2 α/2 percentile and 1-α/2 percentile. $$\frac{(n-1)S^2}{\chi^2_{(1-\frac{\alpha}{2},n-1)}}\le \sigma^2 \le \frac{(n-1)S^2}{\chi^2_{(\frac{\alpha}{2},n-1)}}$$
Proportion confidence interval (go to calculator)
What is the proportion confidence interval?
The proportion confidence interval is a range that is likely to contain the true value of the proportion.
When you choose a 0.95 confidence level, if you would calculate the confidence interval over an infinite number of samples, 95% of the calculated confidence intervals will contain the true value.
What is the proportion sampling distribution?
The proportion sampling distribution is based on the binomial distribution, The binomial distribution is related to the number of successes (x), p = x / n, hence np distribution is binomial.
Methods to calculate the proportion confidence interval
Clopper–Pearson interval (exact)
The Clopper–Pearson is the exact calculation base on the binomial distribution and calculated with the beta distribution. $$Left=Bin(\frac{\alpha}{2},x,n-x+1)\\ Right=Bin(1-\frac{\alpha}{2},x+1,n-x) $$Normal approximation interval
For a large enough sample size, the sample proportion distributes normaly: $$\hat{p}=\frac{successes}{n} \sim N(\hat{p},\sqrt{\frac{\hat{p}(1-\hat{p})}{n}})$$ Following the confidence interval formula: $$\hat{p}\pm Z_{\alpha/2} \sqrt{\frac{\hat{p}(1-\hat{p})}{n}}$$ The Normal approximation doesn't support good result for edge proportions, near 0 or 1.Wilson score interval ✔
The Wilson score interval supports better results than the Normal approximation interval, especially for small sample sizes and for edge proportions, near 0 or 1.
Surprisingly it also supports a better result than the Clopper–Pearson interval (exact)
Wilson score interval with continuity correction
The Wilson score interval with continuity correction support similar results as the exact test, but the Wilson score interval seems to be better than the exact test, so it is better without the continuity correction.
$$ Left=\max[0,\frac{2n\hat{p}+z^2- (z \sqrt{z^2-\frac{1}{n}+4n\hat{p}(1-\hat{p})+(4\hat{p}-2)}+1)}{2(n+z^2)}]\\ Right=\min[1,\frac{2n\hat{p}+z^2+ (z \sqrt{z^2-\frac{1}{n}+4n\hat{p}(1-\hat{p})-(4\hat{p}-2)}+1)}{2(n+z^2)}]$$What is the best method to calculate the proportion confidence interval?
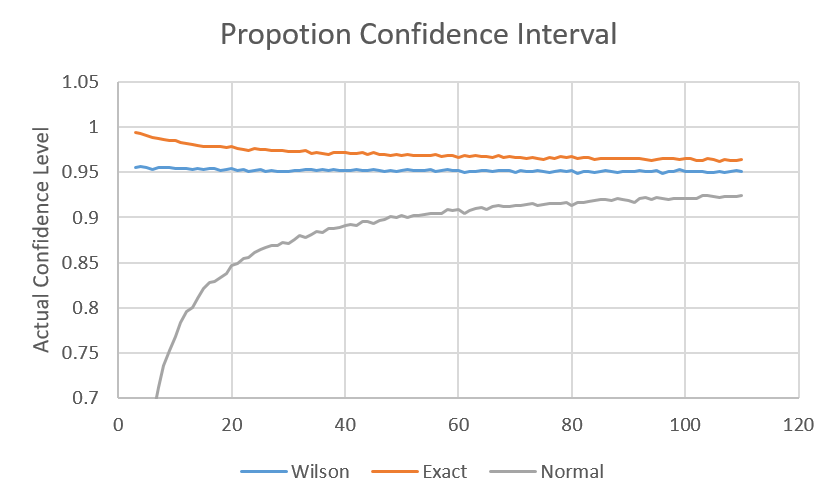
The proportion confidence interval is based on the sample proportion. You may expect that the exact confidence interval (Clopper–Pearson) using the binomial exact distribution and not approximation will be the best method, but it appears that the Wilson score interval is the recommended method.
The Clopper–Pearson confidence interval is usually too wide with an actual confidence level that is larger than the required confidence level, and the Normal approximation confidence interval is usually too narrow with an actual confidence level that is smaller than the required confidence level.
The "Wilson score interval with continuity correction" seems to have similar results as the Clopper–Pearson method.
The following charts were created with R simulation, using the "binom.confint" function (conf.level =0.95) and the following methods:
"Wilson": Wilson score interval, "Exact": Clopper–Pearson interval, "Asymptotic": Normal approximation, "prop.test": "Wilson score interval with continuity correction".
The R simulation checked the actual confidence level, the proportion of times that the true value of the proportion was inside the calculated confidence interval. We would expect this proportion to be equal to the confidence level (0.95).
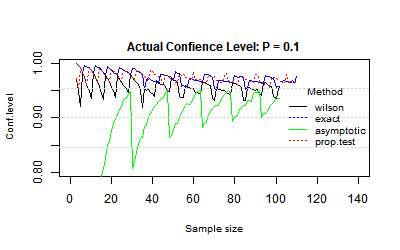
Since the binomial distribution is discrete, the charts are not stable, with different results for n and for n+1.
The Wilson score interval actual confidence level fluctuated around 0.95.
Proportion confidence interval results
| Method | Range | Confidence Level | Small size | *Edge proportion |
|---|---|---|---|---|
| Clopper–Pearson interval (exact) | Wider | CL > 0.95 | np ≥ 10 | np ≥ 10 |
| Normal approximation interval | Narrower | CL < 0.95 | ✔ | ✔ |
| Wilson score interval | Good | CL ≈ 0.95 | ✔ | ✔ |
| Wilson score interval with continuity correction | Wider | CL > 0.95 | ✔ | ✔ |
*Edge proportion - p near-zero or p near one. **Wilson score interval with continuity correction seems to have similar results as Clopper–Pearson interval.
Actual confidence level - random P
When we use p as random proportion, with Unify distribution U(0,1) we get a nice and smooth chart, which makes it easier to compare the methods in the higher level, but it is more correct to look at the next charts with specific proportion value.
Actual confidence level: P = 0.05
When P is small, n*p is also small. For example when n = 100, n*p = 5 (less than 10.).
The Normal approximation line is not stable and usually supports a too low confidence level, lower than 0.95.
The exact method is stable even for small sample size, but usually supports a too high actual confidence level, higher than 0.95.
The Wilson score supports a stable result from around n = 10, the actual confidence level is around 0.95.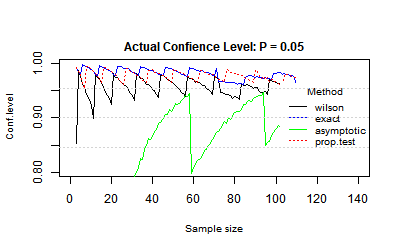
Actual confidence level: P = 0.1
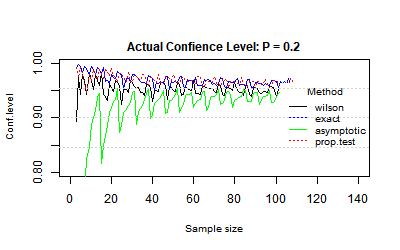
Actual confidence level: P = 0.2
Actual confidence level: P = 0.4
For a small sample size, the Normal approximation is not stable, the confidence level it supports is too low.
When n = 25, n*p = 10, and the Normal approximation starts to be stable and supports a better confidence level, but usually is still too small.
The exact method is stable even for a small sample size but usually supports a too high confidence level.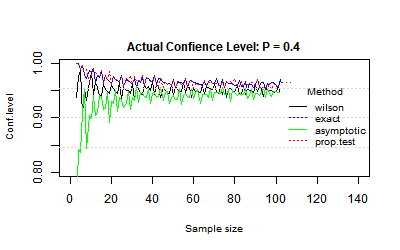
Reference
A. Agresti and B.A. Coull, Approximate is better than "exact" for interval estimation of binomial proportions, American Statistician, 52:119--126, 1998.