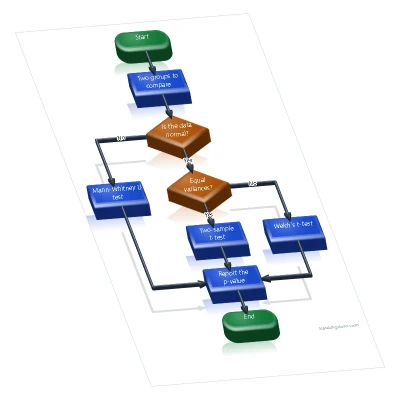
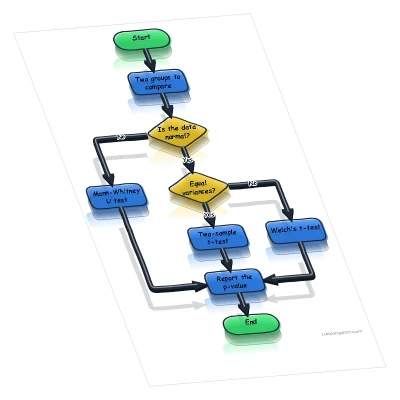
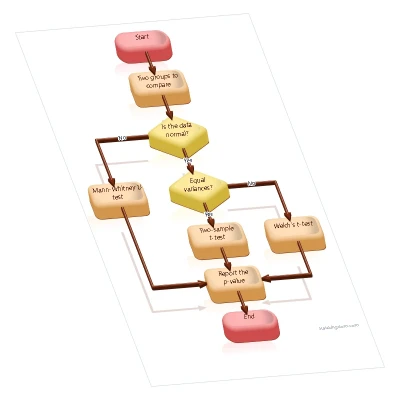
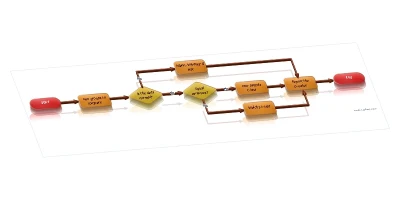
Plastic 3D flowchart
Shiny blocks, like toy bricks.
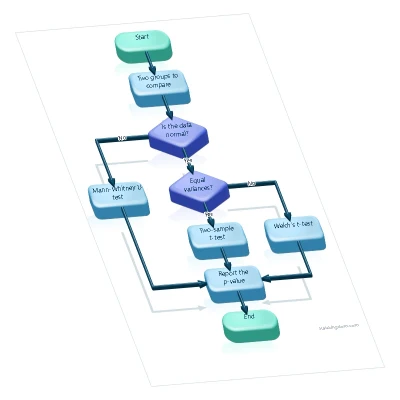
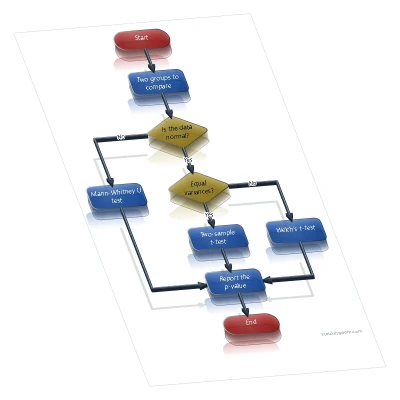
Glass 3D flowchart
See-through blocks with a clear shine.
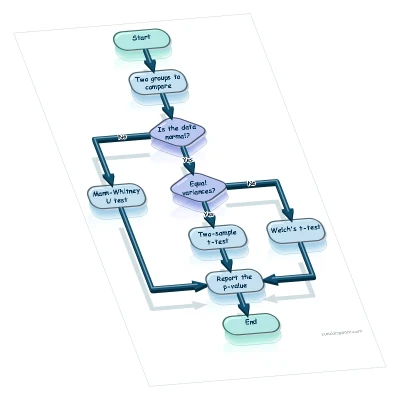
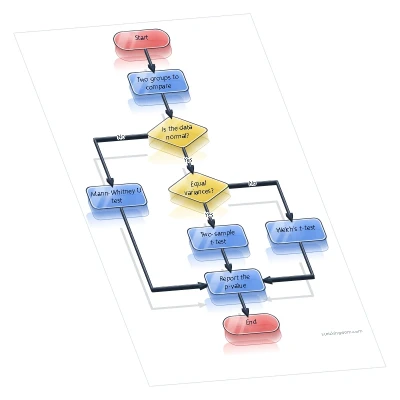
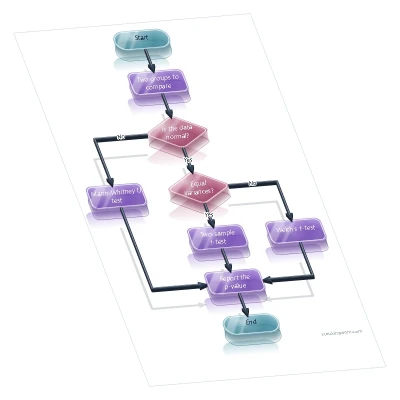
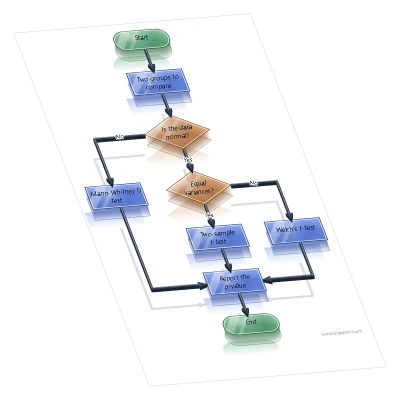
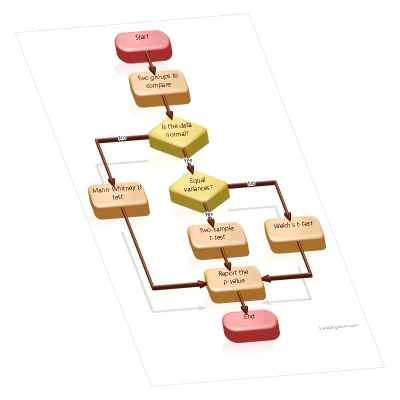
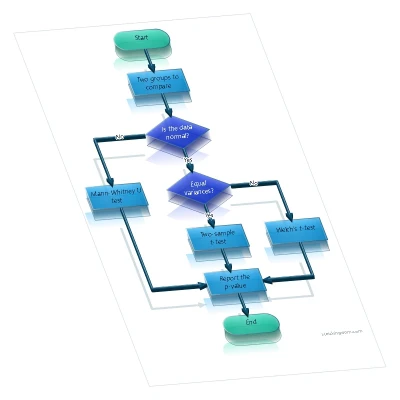
Tinted glass 3D flowchart
Glass with a soft color in it.
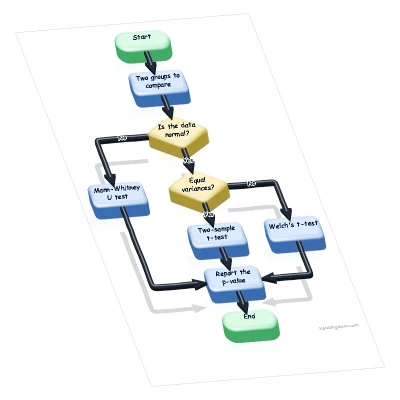
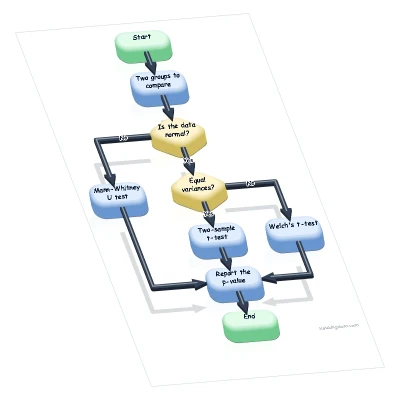
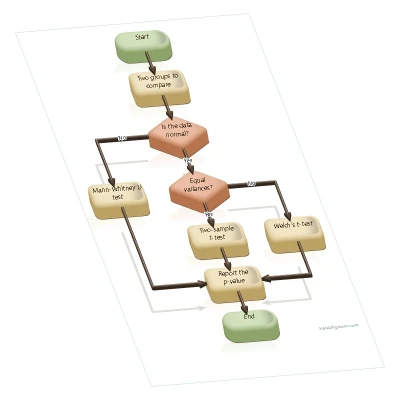
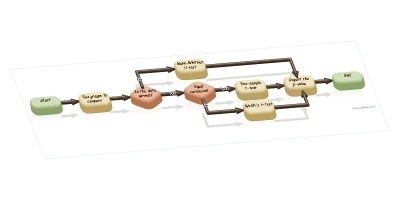
Soft clay 3D flowchart
Gentle, matte shapes that look hand made.
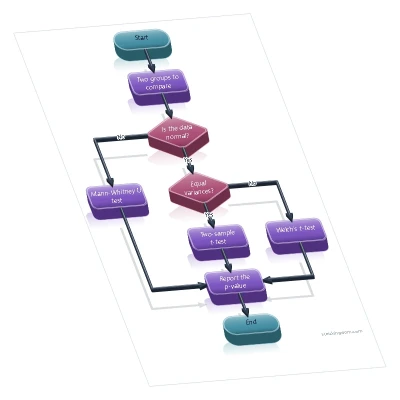
Matte metal 3D flowchart
A calm, brushed look for serious reports.
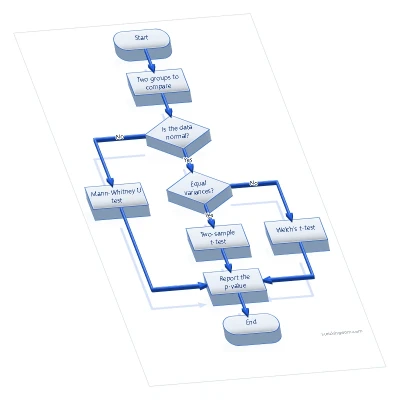
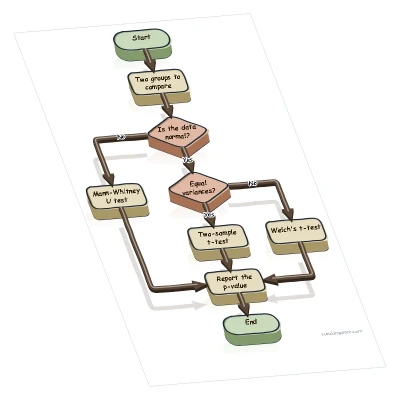
Soft glow 3D flowchart
Light in the middle of every block.
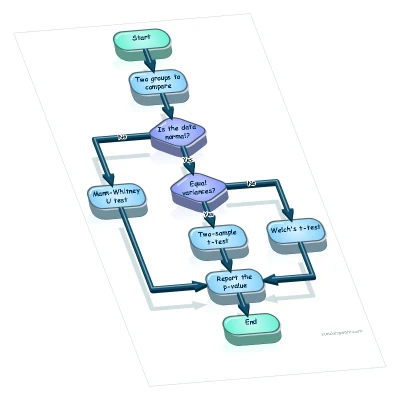
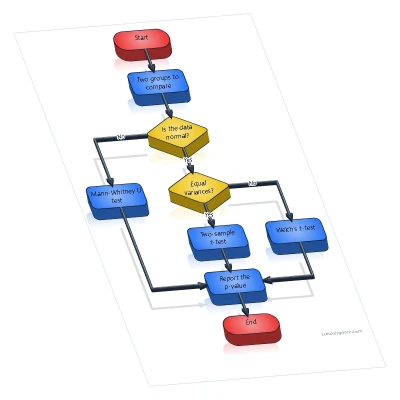
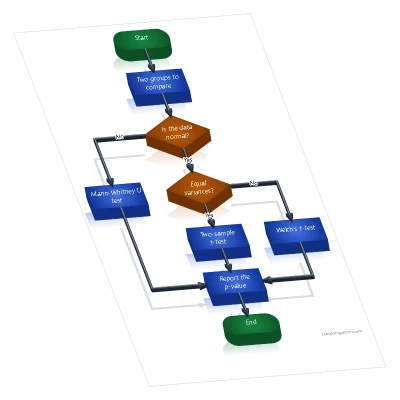
Color bar 3D flowchart
White blocks with a bar of color on top.
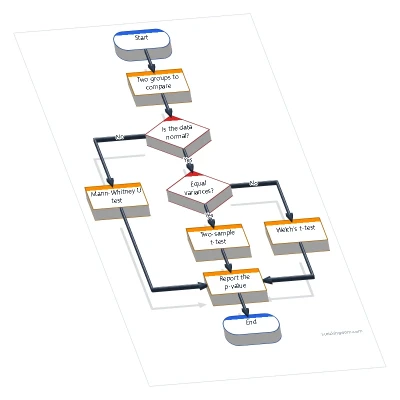
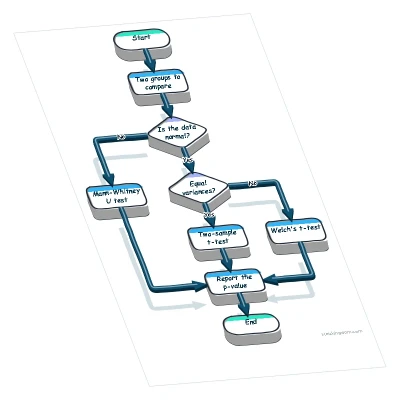
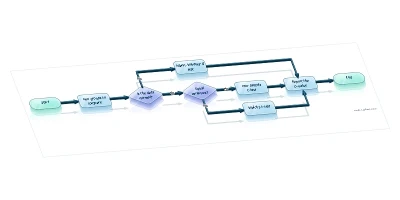
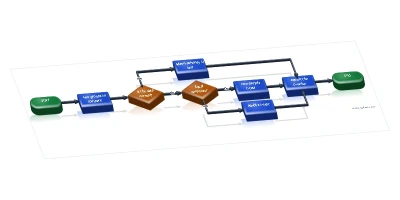
Left to right 3D flowchart
The steps run across the page, good for slides.
4 tips for a good 3D flowchart
- Keep each step to a few words. The blocks are small, and short words stay easy to read.
- Use one look for the whole chart. Glass and plastic suit slides, matte metal and soft clay suit printed reports.
- Let the chart read from top to bottom, or from left to right for a wide slide.
- Need a chart with lanes, a tree or a database diagram? The same maker also draws a swimlane flowchart, an org chart, a decision tree and an ERD.
Make your own
Open the flowchart maker, type your steps in a table or draw them on the paper, and pick a 3D look. Download the chart as a PNG picture or an SVG file, or copy it straight into Word, PowerPoint or Google Slides. It is free, with no sign-up.