T-test
The Chi-squared test is not one test, but a group of tests which constitutes of all statistical tests which have chi-squared distribution.
When the sample is more than 30 you should still use the T Distribution, but using the normal distribution instead will support similar results. The chi-squared distribution is an artificial distribution used on a normal population.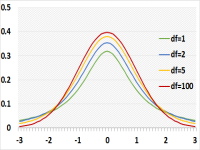
Pearson's chi-squared test (Go to the calculator)
The Pearson's chi-squared test checks a categorical variable.
The test compares an expected model, the expected frequencies, with the actual observations.
It is very useful test, since it may compare any model to the actual observations.
Since the model calculates the probability for each value of the categorical variable, the multinomial distribution (generalization of the binomial distribution) is the exact model, while the chi-squared distribution is only approximation.
Despite being approximation the chi-squared distribution provide excellent results, the reason Examples:
1. Checks if the data assume distribution makes sense. In this case the expected model is the assumed distribution, for example normal distribution.
Assumptions
- Independent samples
- The population have a normal distribution.
- The standard deviations of the population is unknown, the sample size is small or both
- The population mean is known
Required sample data
Calculated based on a random sample from the entire population
- x̄ - Sample average
- S - Sample standard deviation
- n - Sample size
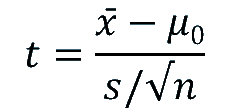
Test statistic
Two-sample t-test - equal variance (pooled-variance) (Go to the calculator)
We use this test to check if the Mean of group1 is the same as the Mean of group2, or the known difference between the groups is correct, and the standard deviation is identical for the groups
The null hypothesis assumes that the known difference between the groups is correct. When the known difference is zero, The null hypothesis assumes the Means of the groups are identical.
Assumptions
- Independent samples
- Both populations have a normal distributions
- Unknown standard deviation, a small amount of data, or both.
- Both populations have equal standard deviations.
If this assumption is incorrect. The test will not supply good results. - The difference (d) between the means of both groups' means is known.
Required sample data
Calculated based on a random sample from the entire population
- x̄i - Sample average of group i
- Si - Sample standard deviation of group i
- ni - Sample size of group i
Test statistic
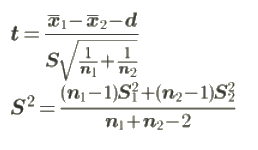
DF (Degrees of Freedom) = n1 + n2 - 2
Two-sample t-test (Welch's T-test) (Go to the calculator)
We use this test to check if the Mean of group1 is the same as the Mean of group2, or the known difference between the groups is correct, while the standard deviation is NOT identical for the two groups.
The assumptions and required sample data of the Welch’s T-test are similar to the Pooled-Variance T-test with one exception - this time we assume that the standard deviation of the groups is not the same
Assumptions
- Independent samples
- Both populations have a normal distributions
- Unknown standard deviation, a small amount of data, or both
- Unequal variances, both groups don't have the same standard deviation
If this assumption is incorrect. The test will still supply reasonable results - The difference (d) between the means of both groups' means is known.
Required sample data
A few statistical inputs are calculated based on a random sample from the entire population:
- x̄i - Sample average of group i
- Si - Sample standard deviation of group1 and group i
- ni - Sample size of group1 and group i
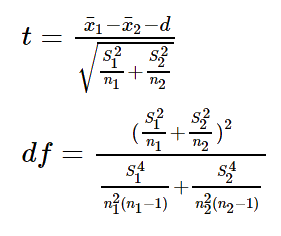
Test statistic
How do you know if the standard deviation of the groups is the same?
If you have preliminary knowledge, it is an easy decision, but what happened if you don’t?
Using Welch’s T-test (unequal variances) with equal variance across samples will support reasonable results with relatively minor differences from the correct pooled-variance t-test (equal variances)
When using Pooled-Variance T-test (equal variances) with unequal variances across samples it will not support good results (unless using equal sample sizes)
The common practice was to run a test to compare the standard deviation, of the groups and then decide which t-test to run.
This method is not so recommended, as in the case of type-2 error for the first step (failing to reject the null hypothesis) we assume that the standard deviations are equal while actually, it is not. In this case, we will run the pool-variance t-test instead of the unequal variances.
Conclusion
If you don’t know if the standard deviations are equal you should run the Welch’s t-test (unequal variances)
Example Table: Error when using incorrect test pooled-variance t-test via Welch’s t-test
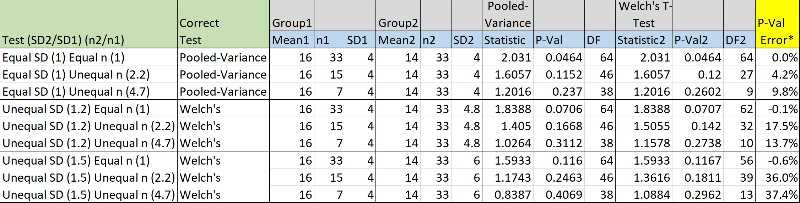
* P-Val Error = 1 - (Correct P-Val / Incorrect P-Val)
Paired T-Test (Go to the calculator)
In paired samples, we compare the results of the same items in two different conditions.
For example before treatment and after treatment. ie: to test a new cholesterol pill, an experiment is performed and results are collected before they took the pill and several days after. Unlike a regular T-test where there are two groups of people – one who took the pill and one who didn’t, this test constitutes of the same group of people both before and after taking the pill. This test is more powerful than regular T-test since we use the same “lab rat” for both samples, instead of different lab rats for each sample, thus limiting noise.
The null hypothesis assumes that the known difference between the groups is correct. When the known difference is zero, The null hypothesis assumes the Means of the groups are identical
Degrees of freedom equal number of items minus one (or number of observation divided by 2 minus 1)
Assumptions
- Dependent paired samples
- The population's distribution approaches a Normal Distribution
- The difference (d) between both groups Mean is known
- Expected difference between any paired samples
Required sample data
- Xd=X2-X1, per each item you calculate the difference between the two groups
- Sd – the standard deviation of the differences
- M0 – expected difference between the two groups
- n – number of pairs
Test statistic

DF (Degrees of Freedom) = n – 1
References:
- The following reference was titled for psychologists, albeit it is relevant to any category
Delacre, M., Lakens, D., & Leys, C. Why psychologists should by default use Welch’s T-test instead of Student’s T-test - Graeme D. Ruxton.The unequal variance T-test is an underused alternative to Student's T-test and the Mann–Whitney U test
- Markowsli CA & Markowsli EP. Conditions for the Effectiveness of a Preliminary Test of Variance