Z-test and T-test sample size calculator

T-test sample size calculator, and z-test sample size calculator
The sample size calculator computes the sample size to gain the required test power and draws a power analysis chart.
You should calculate the sample size before performing the research.
Use this test for one of the following tests:
- For One Sample Z-Test choose the following:
Distribution: Normal.
Sample: One sample. - For One Sample T-Test choose the following:
Distribution: T.
Sample: One sample. - Two Sample Z-Test choose the following:
Distribution: Normal.
Sample: Two samples. - Two Sample T-Test (Pooled variance) choose the following:
Distribution: T.
Sample: Two samples.
Standard deviations: Equal σ. - Two Sample T-Test (Welch's) choose the following:
Distribution: T.
Sample: Two samples.
Standard deviations: Unequal σ.
- Choose what tailed test you plan to use in your research:
The one-tailed test, left or right, is more powerful than the two-tailed test and results in a smaller p-value, half since the t distribution is symmetrical. You should choose it if only one direction is interesting, but the question of when to use the one-tailed test is controversial.
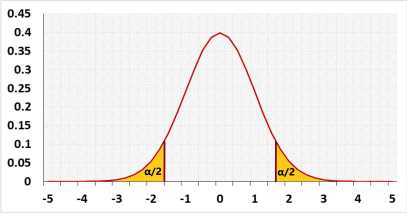
Two - the alternative hypothesis states that the population's mean is either smaller or bigger than the expected mean.
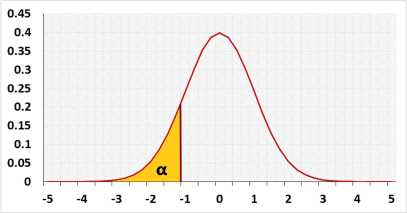
Left - the alternative hypothesis states that the population's mean is smaller than the expected mean.
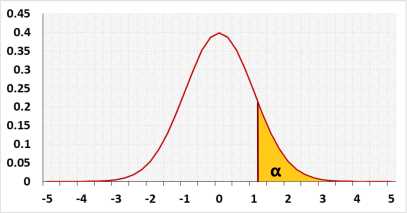
. Right - the alternative hypothesis states that the population's mean is bigger than the expected mean.
. - Choose the Significance level (α) you plan to use: a p-value less than the significance level is statistically significant.
Researchers usually use 0.05, but if the price of a mistake is big, they may use a smaller value like 0.01. - Effect - If you don't know the required effect size, you may use the 'effect' field. The default is 'Medium', if you change the value, it will change 'effect type' to 'Standardized effect size' and fill the proper value per Cohen's suggestion in the 'effect size' field. (0.2: Small, 0.5: medium, 0.8: large) The calculator will not use this field when pressing the 'calculate' button.
- Effect size - the value that you want the test to be able to identify. You need a larger sample size to be able to identify a smaller effect size.
- Effect type
Mean difference (Unstandardized effect size)
Two-sample test - the value in 'Effect size' is the difference between the sample means.
One-sample test - the value in 'Effect size' is the difference betweenthe sample mean and the expected mean.
Cohen's d - (Standardized effect size) - the value in 'Effect size' is the difference between the means divided by the standard deviation. - Rounding - how to round the results?
When a resulting value is larger than one, the tool rounds it, but when a resulting value is less than one the tool displays the significant figures.
Example:
Two-sample t-test (pooled-variance):
Tails=two, Distribution=Student's t, Sample=Two samples, α=0.05, Power=0.8 , Effect Size=0.5, Standard deviation=Equal &sigma.
Example results:
The sample size 64 for each group, will gain the power of 0.80146. (n1 = n2 = 64).
Since the sample size is discrete, we look for the first n that gains the test power of 0.8 or more. In this example, a sample size of 63, gains the test power of 0.795168.
Distribution