Multiple Linear Regression Calculator
Multiple regression calculator with unlimited predictors.

Header: You may change the groups' names to their real names.
Data: When entering data, press Enter or Comma , or Space after each value.
* All variables will be included in the automatic iterations mode.
** Normality colors based on α=0.05
Data: When entering data, press Enter or Comma , or Space after each value.
* All variables will be included in the automatic iterations mode.
** Normality colors based on α=0.05
Reporting results in APA style
Multiple linear regression calculator
The calculator uses variables transformations, calculates the Linear equation, R, p-value, outliers and the adjusted Fisher-Pearson coefficient of skewness.
After checking the residuals' normality, multicollinearity, homoscedasticity and priori power, the program interprets the results.
Then, it draws a histogram, a residuals QQ-plot, a correlation matrix, a residuals x-plot and a distribution chart.
You may transform the variables, exclude any predictor or run backward stepwise selection automatically based on the predictor's p-value.
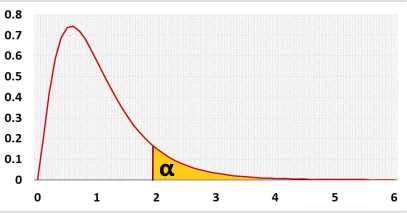
Right-tailed F test. Checks if the entire regression model is statistically significant. Why?
It is easier to use the matrix form for multiple linear regression calculations:
Y = XB + Ε
Ŷ = XB
B = (X'X)-1X'Y
Y - dependent variable vector.
Ŷ - predicted Y vector.
Ε - residuals vector, Ε = Y - Ŷ.
p - number of predictors.
n - sample size.
Multiple linear regression formula
Y = b0 + b1X1 + b2X2 + b3X3+...+ bpXp + εIt is easier to use the matrix form for multiple linear regression calculations:
Y = XB + Ε
Ŷ = XB
B = (X'X)-1X'Y
| [1 X11 X12 ... X1p] | [Y1] | ε1] | |||
| [1 X21 X22 ... X2p] | [Y2] | [ε2] | |||
| X = | [1 X31 X32 ... X3p] | Y = | [Y3] | Ε = | [ε3] |
| [1 X41 X42 ... X4p] | [Y4] | [ε4] | |||
| [1 Xn1 Xn2 ... Xnp] | [Yn] | [εn] |
| [B0] | |
| [B1] | |
| B = | [B2] |
| [... ] | |
| [Bp] |
Ŷ - predicted Y vector.
Ε - residuals vector, Ε = Y - Ŷ.
p - number of predictors.
n - sample size.
Hypotheses
H0: Y = b0
H1: Y=b0+b1X1+...+bpXp
Test statistic

F distribution