Logistic Regression Calculator
tails: using to check if the regression formula and parameters are statistically significant.

Hypotheses
| H0: ln(odds) = b0 | |
| H1: ln(odds) = b0+b1X1+...+bpXp |
Test statistic
χ2 = 2(LL1-LL0)
χ2 distribution
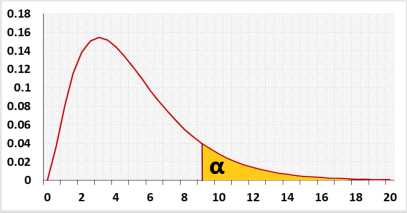
Test calculation
Statistic Data
The dependent data (Y) can take multiple columns or be condensed into one.
Click the following example, it contains the same data arange as one Y column or as several Y columns
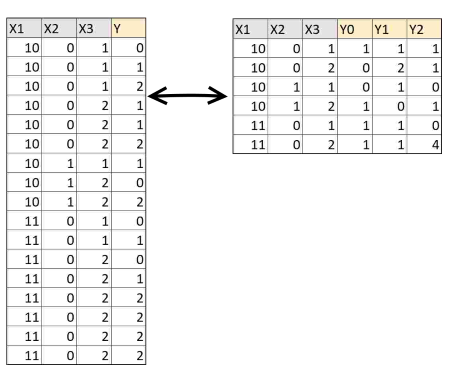
Click the following example, it contains the same data arange as one Y column or as several Y columns
Enter sample data directly
Header: You may change groups' name to the real names.
Data: When entering data, press Enter after each value.
Enter sample data from excel
Number of y columns: (When the value is 0, the tool will count automatically headers with "Y")
You may copy data from Excel, Google sheets or any tool that separate data with Tab and Line Feed.
Copy the data, one block of consecutive columns includes the header, and paste below.
Y must be the right columns. . click to see an example: ![]()
After the calculation, the tool will copy the data to the columns view for a better flexibility
The tool uses Newton's Method. Different methods may have slightly different results, the greater the log-likelihood the better the result.

validation message
Newton's Method
Correlation matrix
tresults2